Moving Average Convergence Divergence (MACD) is a popular trading indicator that can help you analyze market movements and make better trades. But have you heard of Impulse MACD, a variation that offers even more benefits for traders? Impulse MACD is an oscillator-style trading indicator that is based on the traditional MACD indicator. It is designed to identify short-term price movements in ranging markets.
In this step-by-step guide, we’ll explore everything you need to know about Impulse MACD and how you can use it to your advantage in ranging markets. From configuring and customizing the indicator to creating a solid trading plan, we’ll cover all the basics of this strategy, so you can confidently use Impulse MACD in your trading strategy. Let’s get started.
Table of Contents
- What is MACD?
- What is Impulse MACD?
- Impulse MACD Formula & Calculation
- Impulse MACD settings
- Impulse MACD on eToro
- Impulse MACD binance
- MT4 impulse MACD indicator
- Impulse MACD thinkorswim
- Elder Impulse System
- Impulse MACD Python
- Impulse MACD TradingView
- Impulse MACD [LazyBear] – TradingView
- How to filter MACD false signals
- Impulse Trading Tool
- Identifying a Ranging Market
- How To Trade Ranging Markets With Impulse MACD
- Setting up Impulse MACD on Your Trading Chart
- How to Identify Entry and Exit Points With Impulse MACD
- Using Impulse MACD With Other Indicators
- Tips to Manage Risk and Maximize Profits with Impulse MACD
- Conclusion
- FAQ
What is MACD?
MACD, or Moving Average Convergence Divergence, is a widely used technical trading indicator that helps traders identify trends and potential entry and exit points. It is based on the difference between two exponential moving averages (EMA), which are calculated using different time periods. The signal line, which is another EMA of the MACD line, is plotted to help identify potential shifts in momentum.
What is Impulse MACD?
Impulse MACD is a variant of the traditional MACD that can help traders identify ranging markets more effectively. It is designed to filter out the noise and focus on significant price movements or impulses. The key difference between Impulse MACD and traditional MACD is that the former uses a different calculation for the signal line. Instead of using an EMA, it uses a simple moving average (SMA) of the impulse MACD line. Impulse MACD creates a powerful signal that works best when combined with other indicators to identify trading opportunities.
The components of Impulse MACD include the impulse MACD line, which is calculated by subtracting a longer period EMA from a shorter period EMA, and the trigger line, which is the SMA of the impulse MACD line. When the impulse MACD line crosses above the trigger line, it is considered a bullish signal, while a cross below is considered a bearish signal. Traders can use these signals to identify potential entry and exit points in ranging markets.
Impulse MACD Formula & Calculation
The Impulse MACD Formula is a powerful trading indicator used by traders to identify and capitalize on market momentum shifts in online trading. This formula combines two essential technical analysis tools, the Moving Average Convergence Divergence (MACD) and the Rate of Change (ROC). Here’s a breakdown of the formula and how to use it effectively in online trading:
- MACD Calculation: First, calculate the MACD by subtracting a 26-day Exponential Moving Average (EMA) from a 12-day EMA. Then, generate a 9-day EMA of the MACD, which is called the ‘Signal Line.’ The difference between the MACD and Signal Line forms the ‘Histogram.’
- ROC Calculation: The Rate of Change (ROC) is calculated by dividing the current price by the price ‘n’ periods ago (typically 14 periods), and then subtracting 1. Multiply the result by 100 to express the ROC as a percentage.
- Impulse System: Combine the MACD Histogram and ROC by following these rules:
- Buy Signal: Enter a long position when the MACD Histogram is above 0 and the ROC is positive.
- Sell Signal: Enter a short position when the MACD Histogram is below 0 and the ROC is negative.
- Neutral: Remain neutral when the MACD Histogram and ROC signals conflict.
Using the Impulse MACD Formula in online trading allows traders to identify strong price momentum and make more informed decisions on market entry and exit points. By following the buy and sell signals generated by the Impulse System, traders can potentially capitalize on profitable trends while avoiding unfavorable market conditions.
Impulse MACD settings
he Impulse MACD settings refer to the specific parameters within the Impulse MACD Formula that traders can customize to optimize their trading strategies. These settings determine the calculation of the Moving Average Convergence Divergence (MACD) and the Rate of Change (ROC) components, which directly influence the buy, sell, and neutral signals generated by the Impulse System. Here’s an overview of the primary settings and their importance in online trading:
• MACD Settings:
- Short-term EMA (typically 12 periods): Adjusting the number of periods for the shorter Exponential Moving Average can increase responsiveness to recent price changes or smooth out the indicator for a more stable analysis.
- Long-term EMA (typically 26 periods): Modifying the number of periods for the longer Exponential Moving Average allows traders to fine-tune the indicator to capture longer-term trends or focus on short-term price movements.
- Signal Line EMA (typically 9 periods): Changing the number of periods for the Signal Line Exponential Moving Average can either improve signal confirmation or minimize lag time, depending on the trader’s preference.
• ROC Settings:
- Lookback Period (typically 14 periods): Altering the number of periods used for calculating the Rate of Change enables traders to emphasize specific timeframes that may be more relevant to their trading strategy.
By experimenting with these Impulse MACD settings, traders can tailor the indicator to their unique trading objectives and risk tolerance levels. Customizing the settings allows for better alignment with specific market conditions, ultimately enhancing the effectiveness of the Impulse MACD Formula in generating more accurate and timely trade signals.
Impulse MACD on eToro
- Log in to your eToro account.
- Open the chart for the asset you want to analyze.
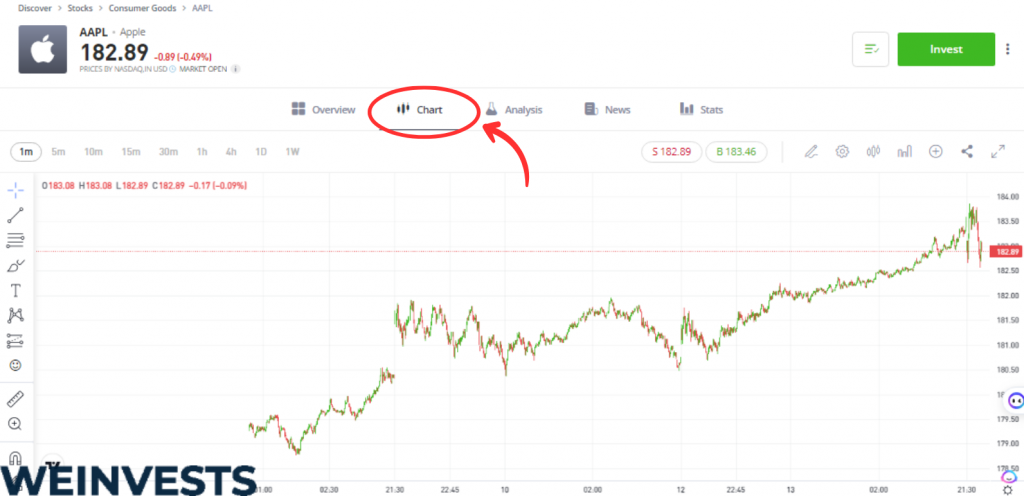
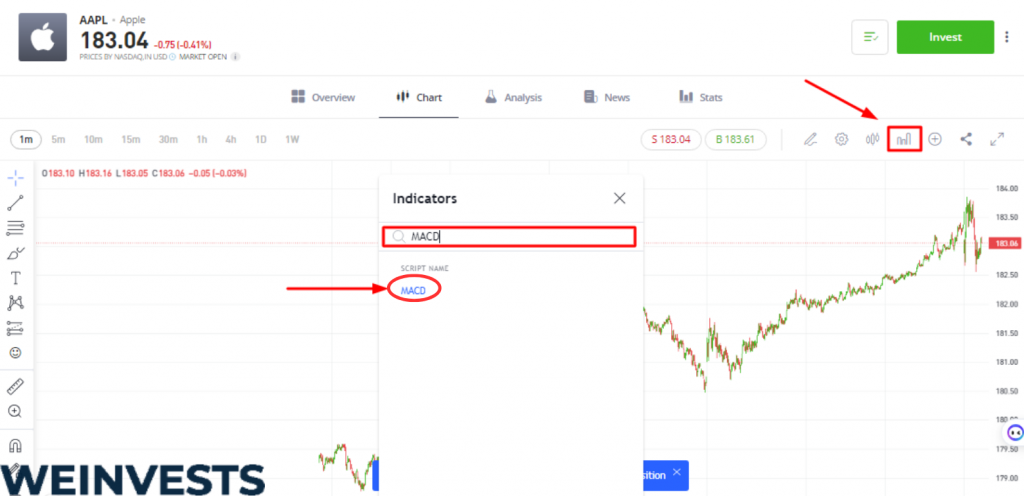
- Look for the “Indicators” option, usually represented with a “f(x)” symbol.
- From the drop-down menu, select “MACD.” A MACD histogram should appear under your price chart.
- The MACD on eToro consists of two lines that move around the zero line: the MACD line and the Signal line. The MACD line is constructed by taking the difference between the 26-day period and 12-day period moving averages of the asset’s closing price. The Signal line is a 9-day period exponential moving average.
- You can interpret the MACD values as follows:
- When the MACD line crosses the zero line and goes above it, this can be interpreted as an upward momentum in the price, suggesting a possible buy trade.
- Conversely, when the MACD line falls below the zero line, this can indicate a downward momentum, which might be an opportunity for a sell trade.
- The interaction between the MACD and the Signal line can also be used to spot possible market turns. If the MACD line crosses the Signal line from below and upwards, this can be seen as a bullish signal. Conversely, if the MACD line crosses the Signal line downwards, this can be a bearish signal.
- A histogram is also displayed, which charts the difference between the MACD line and the Signal line. It is positive when the MACD line is above the Signal line, and negative when it is below.
As for the Impulse MACD, it is a modified version of the MACD, which is designed to reduce whipsaw (sharp moves in price followed by equally sharp reversals) typically seen in sideways markets. The Impulse MACD is formed by filtering out the values in a moving average (MA) range, which is the region between MAs of high and low prices.
This is typically plotted as a histogram, and it also includes the traditional MACD histogram (MACD – Signal) to assist in finding entries/exits. You can use the Impulse MACD like a traditional MACD (for instance, watching for zero line crossing or signal crossing).
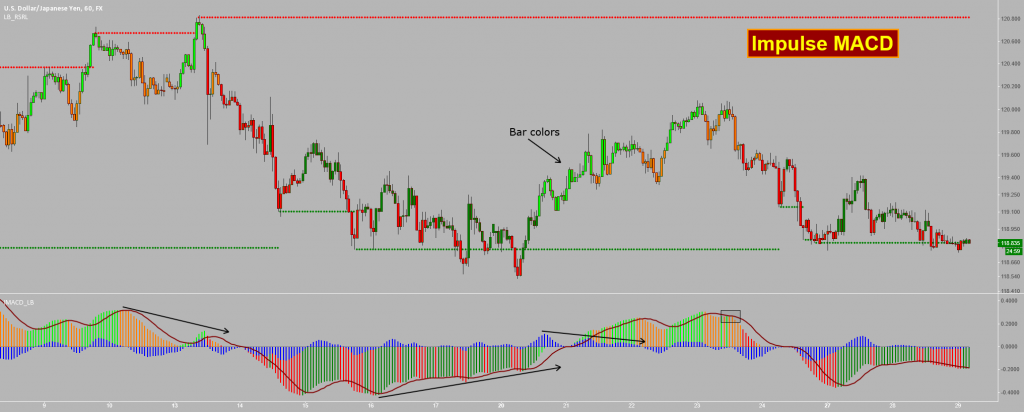
The Impulse MACD is color-coded as follows:
- Lime / Green / Orange / Red: These colors are based on the Impulse MACD’s position with respect to the MidLine and Signal.
- Maroon: This color represents the Impulse MACD Signal.
- Blue: This color represents the histogram of the Impulse MACD minus the Signal.
Remember, the “Impulse MACD” is a powerful tool that, when used correctly, can greatly enhance your trading strategy. However, like any trading tool, it’s crucial to understand it fully and use it as part of a comprehensive trading strategy. Always make sure to test any new indicators or strategies in a risk-free environment before putting real money on the line.
eToro provides a fantastic opportunity for this with its $100,000 demo account. You can use this account to explore the “Impulse MACD” and other trading indicators without risking any real money. This way, you can get a feel for how these tools work and decide if they fit into your overall trading strategy.
Remember, you can switch to a real account anytime you feel ready and start trading with as little as $200. Click here to join eToro and start experimenting with the “Impulse MACD”.
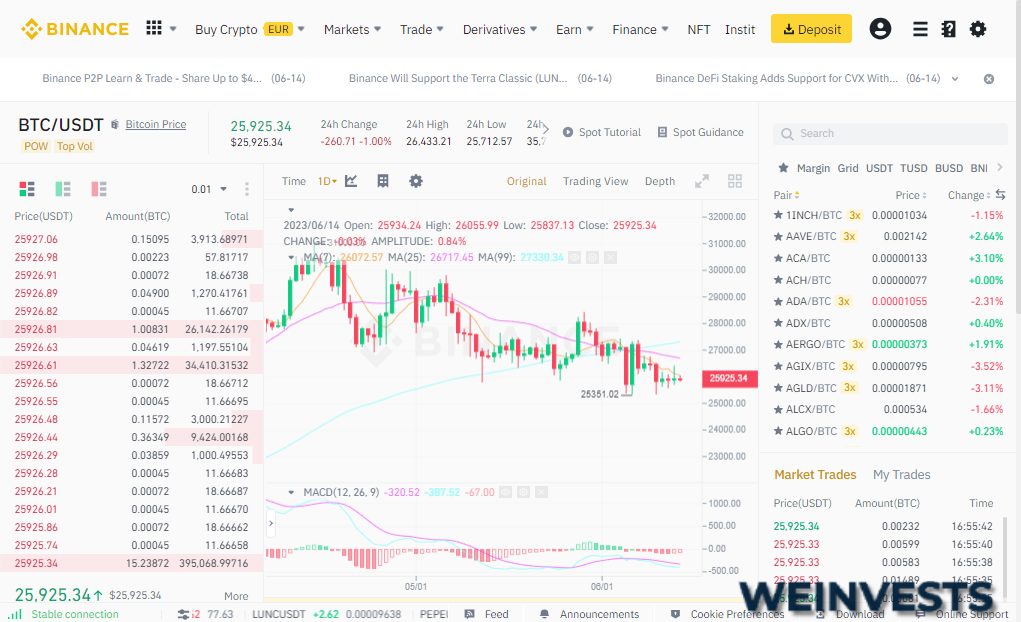
Impulse MACD binance
- Create a Binance account: Sign up for a Binance account at www.binance.com. Complete the registration process and any required identity verification steps.
- Fund your account: Deposit cryptocurrency or fiat currency into your Binance account.
- Access the trading platform: Navigate to the “Trade” section on Binance and select either “Basic” or “Advanced” trading view.
- Choose a trading pair: Select the cryptocurrency trading pair you want to analyze and trade (e.g., BTC/USDT, ETH/USDT, etc.).
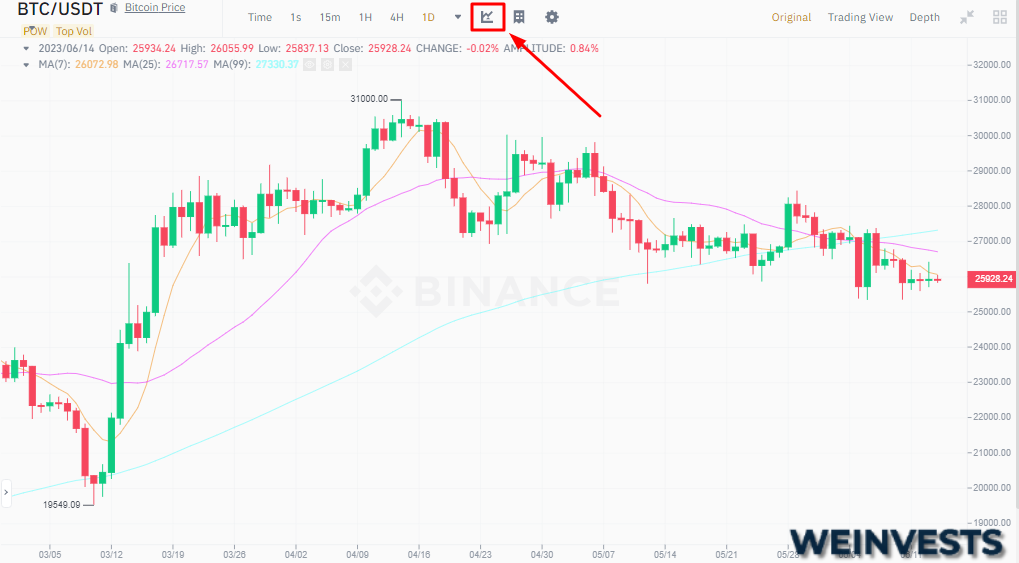
- Add the MACD and ROC indicators to the chart: a. Locate the chart’s indicator menu, usually labeled “Indicators” or represented by a small icon resembling a waveform. b. In the search bar, type “MACD” and click on the “Moving Average Convergence Divergence” indicator to add it to your chart. c. Repeat the process, searching for “ROC” or “Rate of Change” and adding it to your chart.
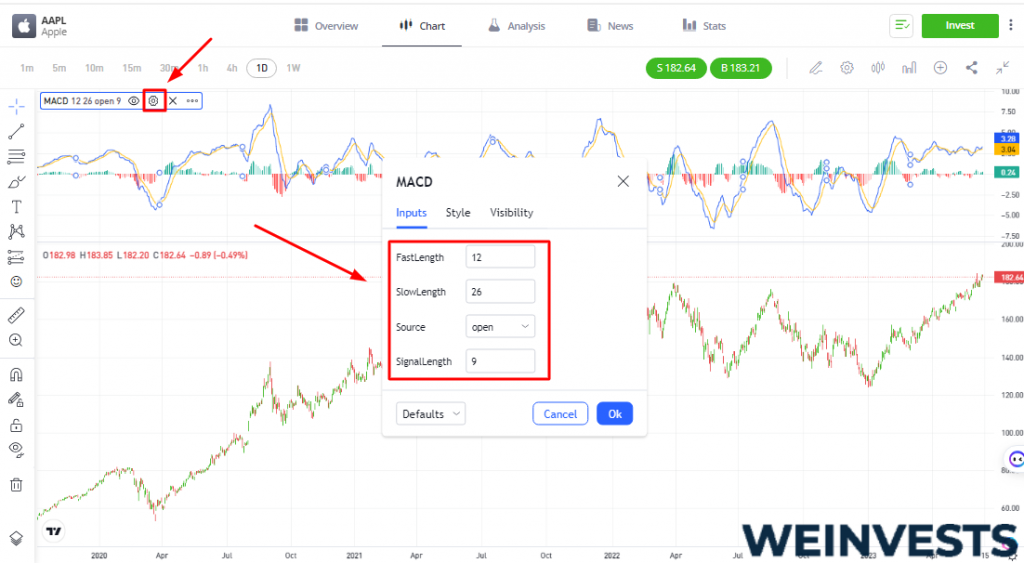
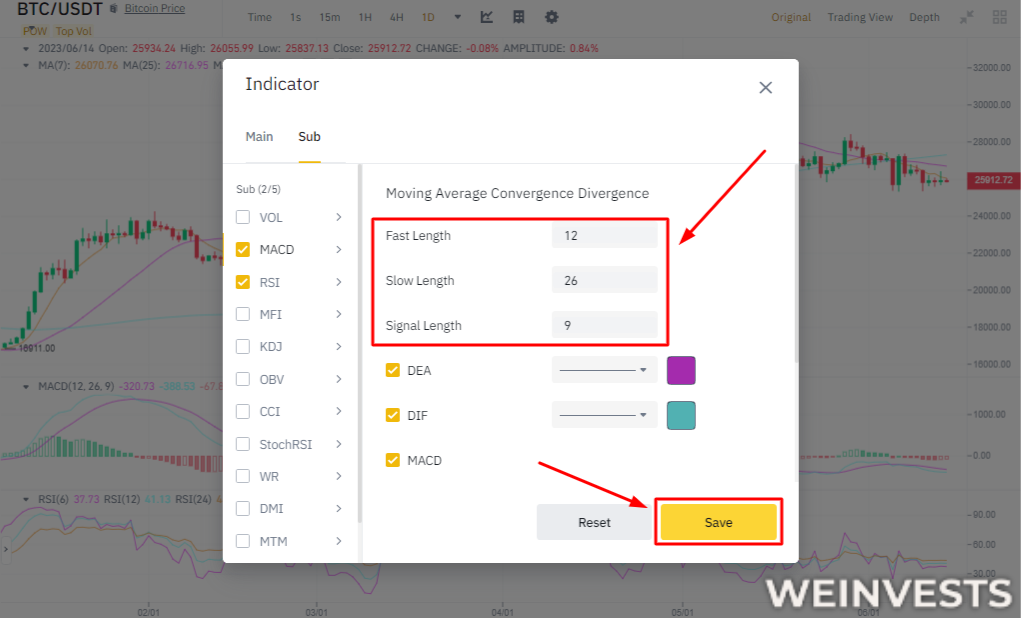
- Customize the MACD settings: Click on the MACD indicator’s settings icon (typically a small gear icon). Adjust the parameters for the short-term EMA (default 12), long-term EMA (default 26), and Signal Line EMA (default 9) to match your trading preferences. Click “OK” to apply the changes.
- Customize the ROC settings: Click on the ROC indicator’s settings icon (usually a small gear icon). Adjust the parameters for the lookback period (default 14) to match your trading preferences. Click “OK” to apply the changes.
- Analyze the Impulse MACD signals on the chart: Visually combine the MACD Histogram and ROC signals to identify buy, sell, and neutral conditions: a. Buy Signal: The MACD Histogram is above 0, and the ROC is positive. b. Sell Signal: The MACD Histogram is below 0, and the ROC is negative. c. Neutral: The MACD Histogram and ROC signals conflict.
- Execute trades based on the Impulse MACD signals: Place buy or sell orders on Binance according to the signals generated by combining the MACD Histogram and ROC, following your trading strategy and risk management principles.
By following these steps, you can effectively use the Impulse MACD Formula for trading cryptocurrencies on the Binance platform. Remember to conduct thorough research and consider practicing with a demo or paper trading account before risking real capital.
MT4 impulse MACD indicator
Here’s a mini guide for using the Impulse MACD Indicator on the MetaTrader 4 (MT4) platform for trading:
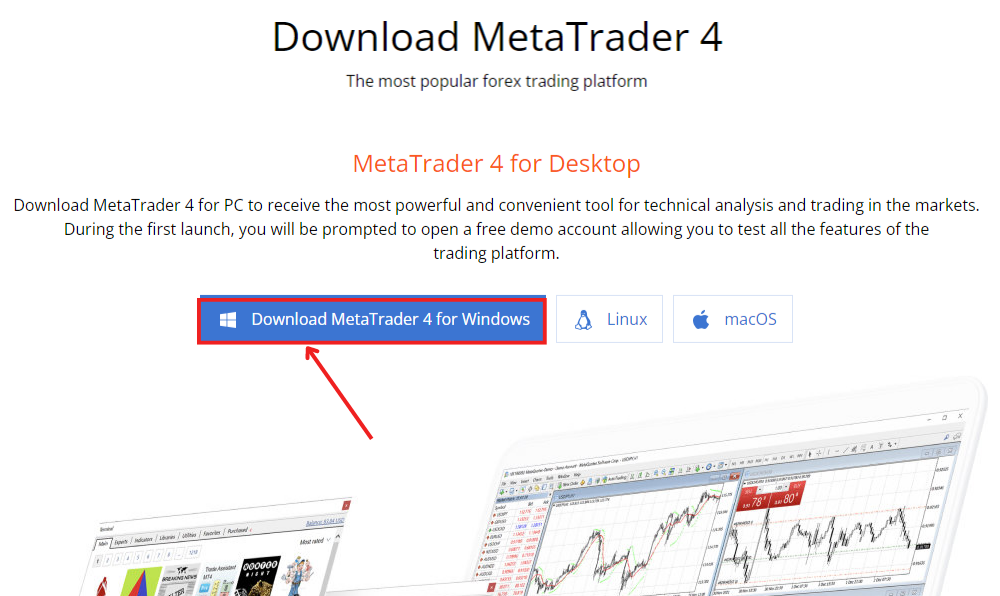
- Install MT4: If you haven’t already, download and install the MetaTrader 4 platform from your broker’s website or the official MetaTrader 4 website.
- Create and fund your trading account: Sign up for a trading account with a broker that supports MT4 and deposit funds to begin trading.
- Open MetaTrader 4: Launch the MT4 platform and log in with your trading account credentials.
- Select a trading pair or financial instrument: In the “Market Watch” window, choose the trading pair or financial instrument you want to analyze and trade.
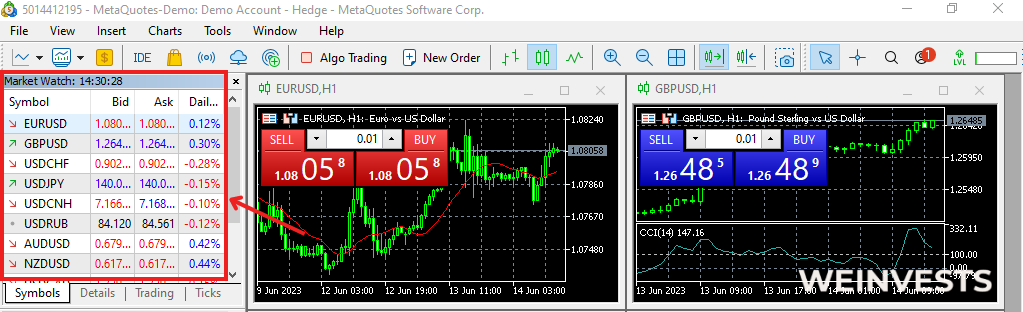
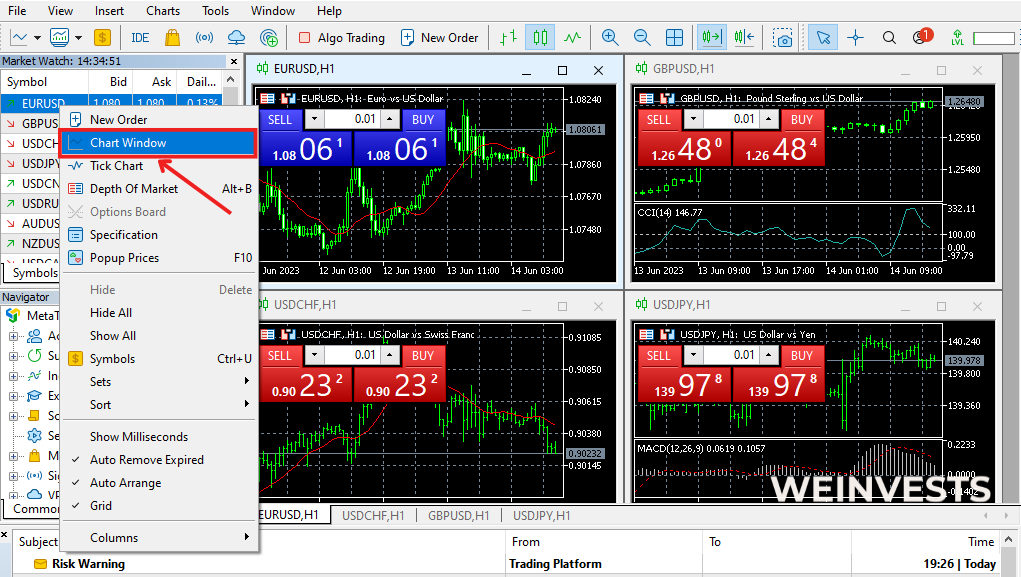
- Open a new chart: Right-click the selected trading pair or financial instrument in the “Market Watch” window and select “Chart window” to open a new chart.
- Add the MACD and ROC indicators to the chart:
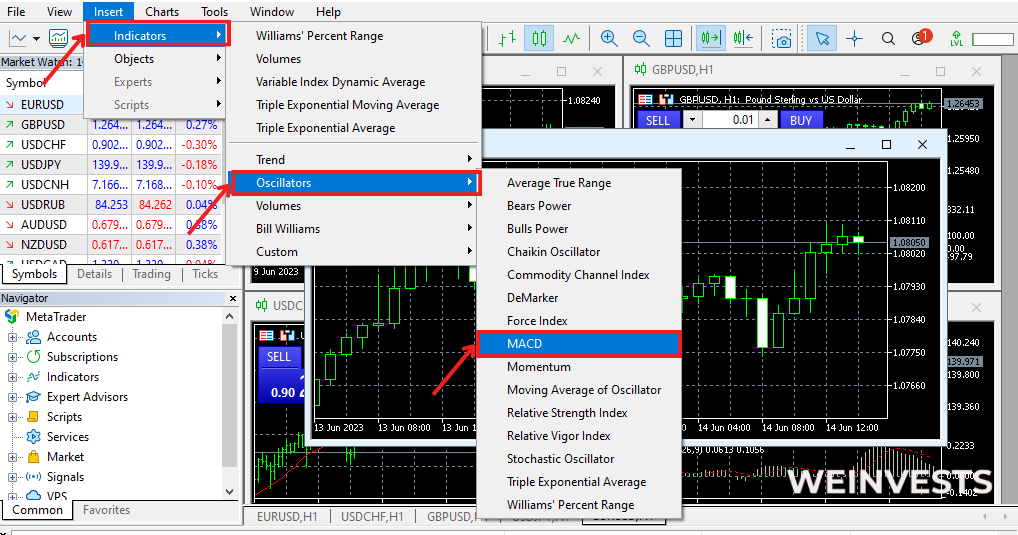
a. Click the “Insert” menu at the top of the platform, navigate to “Indicators,” then “Oscillators,” and select “MACD” to add the Moving Average Convergence Divergence to the chart.
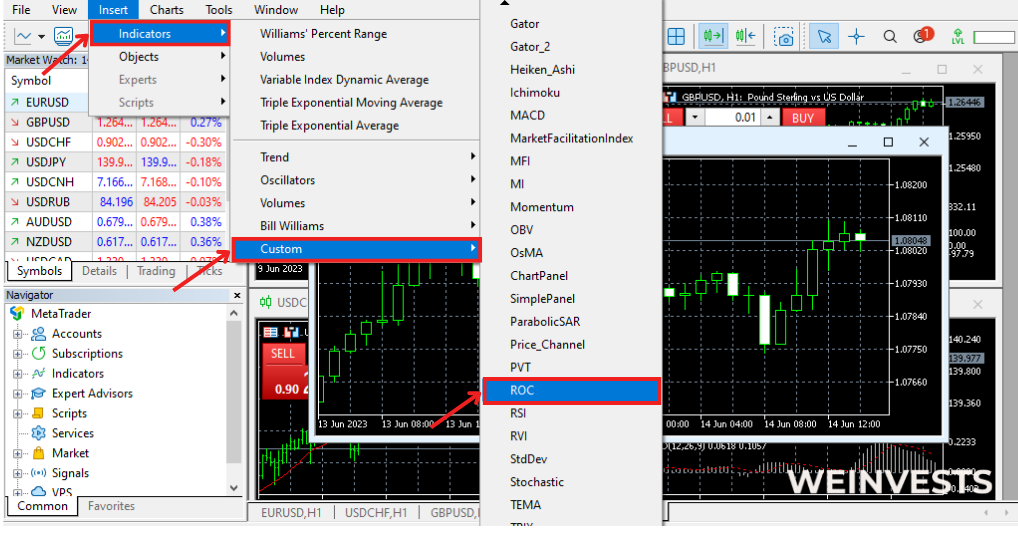
b. Repeat the process, but this time navigate to “Indicators,” then “Custom,” and select “Rate of Change” (ROC) to add it to your chart.
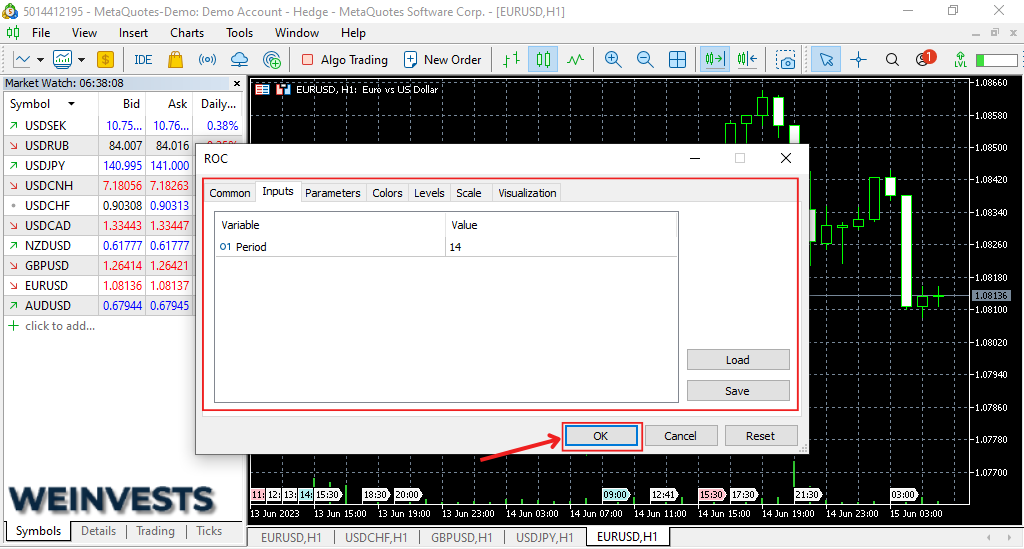
- Customize the MACD settings: Right-click the MACD indicator on the chart, and select “Properties” or “Indicator Properties.” Adjust the parameters for the short-term EMA (default 12), long-term EMA (default 26), and Signal Line EMA (default 9) to match your trading preferences. Click “OK” to apply the changes.
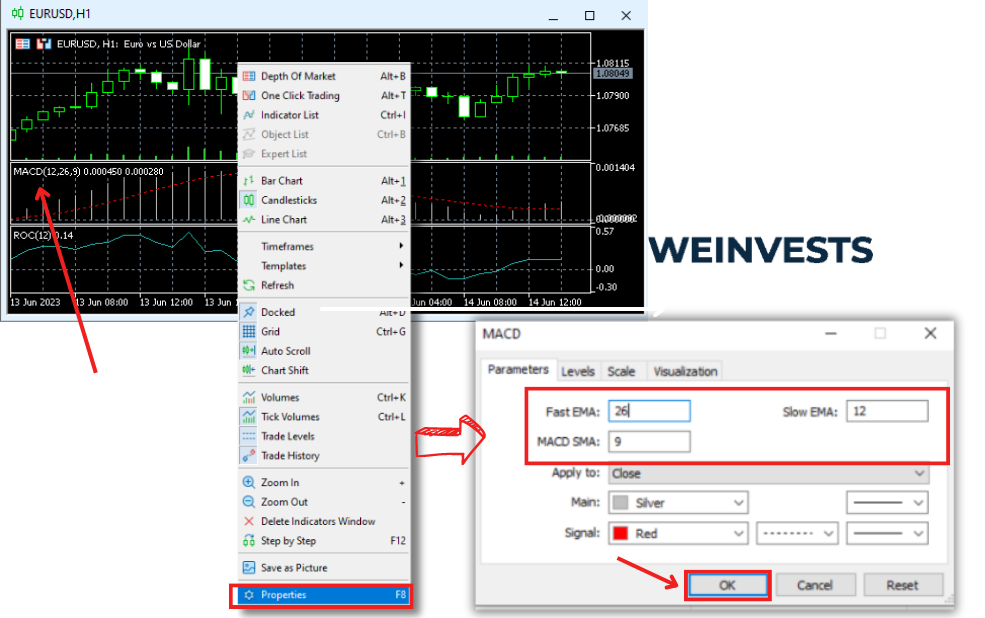
- Customize the ROC settings: Right-click the ROC indicator on the chart, and select “Properties” or “Indicator Properties.” Adjust the parameters for the lookback period (default 14) to match your trading preferences. Click “OK” to apply the changes.
- Analyze the Impulse MACD signals on the chart: Visually combine the MACD Histogram and ROC signals to identify buy, sell, and neutral conditions: a. Buy Signal: The MACD Histogram is above 0, and the ROC is positive. b. Sell Signal: The MACD Histogram is below 0, and the ROC is negative. c. Neutral: The MACD Histogram and ROC signals conflict.
- Execute trades based on the Impulse MACD signals: Place buy or sell orders on MT4 according to the signals generated by combining the MACD Histogram and ROC, following your trading strategy and risk management principles.
By following these steps, you can effectively use the Impulse MACD Indicator on the MetaTrader 4 platform for trading. Remember to conduct thorough research and consider practicing with a demo account before risking real capital.
Impulse MACD thinkorswim
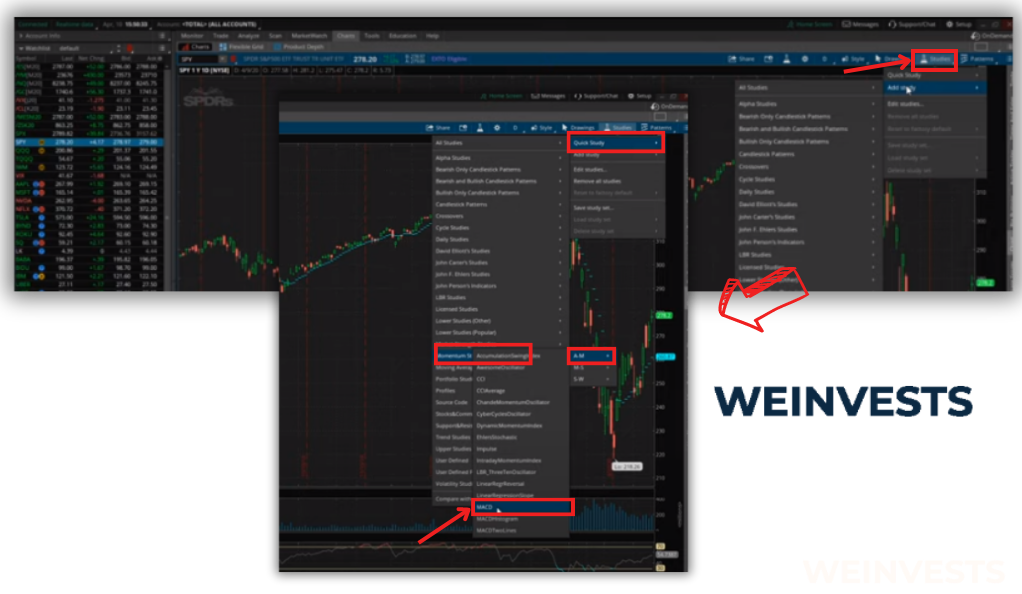
Here’s a step-by-step guide for using the Impulse MACD Formula on the thinkorswim platform:
- Install thinkorswim: If you haven’t already, download and install the thinkorswim platform from TD Ameritrade’s website.
- Create and fund your trading account: Sign up for a trading account with TD Ameritrade and deposit funds to begin trading.
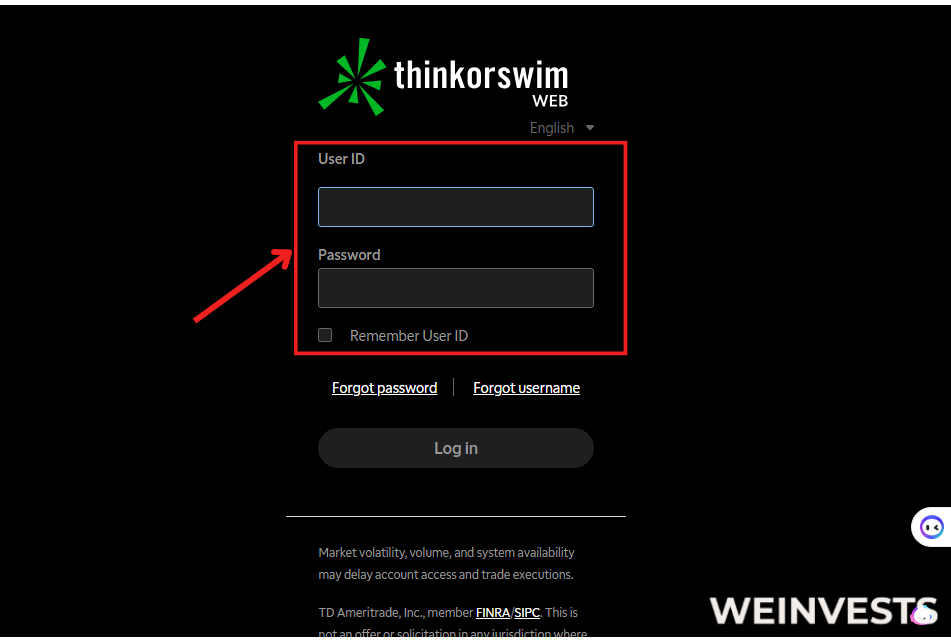
- Open thinkorswim: Launch the thinkorswim platform and log in with your trading account credentials.
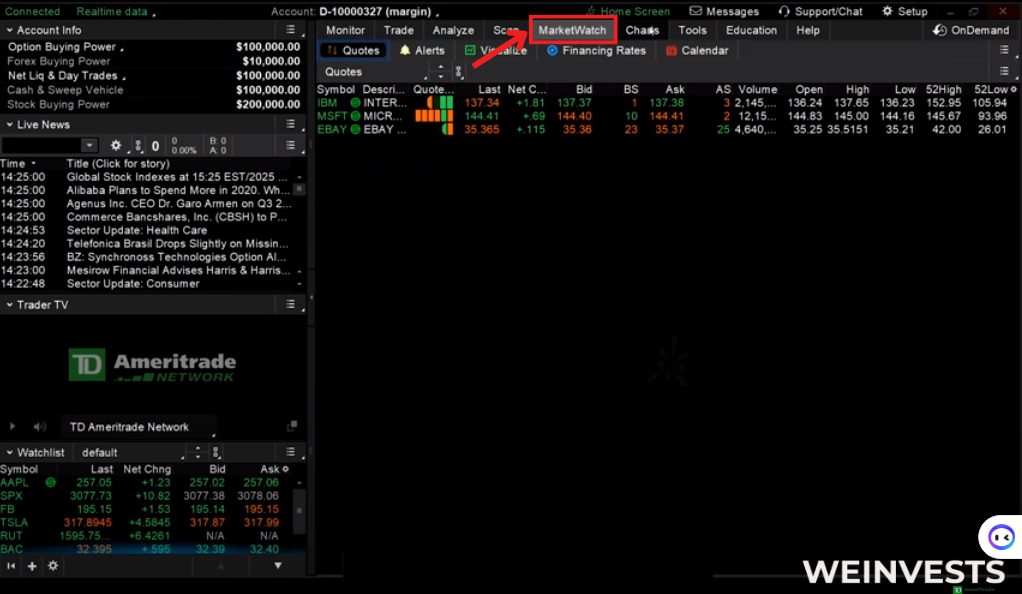
- Select a trading instrument: In the “MarketWatch” tab, choose the financial instrument you want to analyze and trade (e.g., stocks, options, futures, forex).
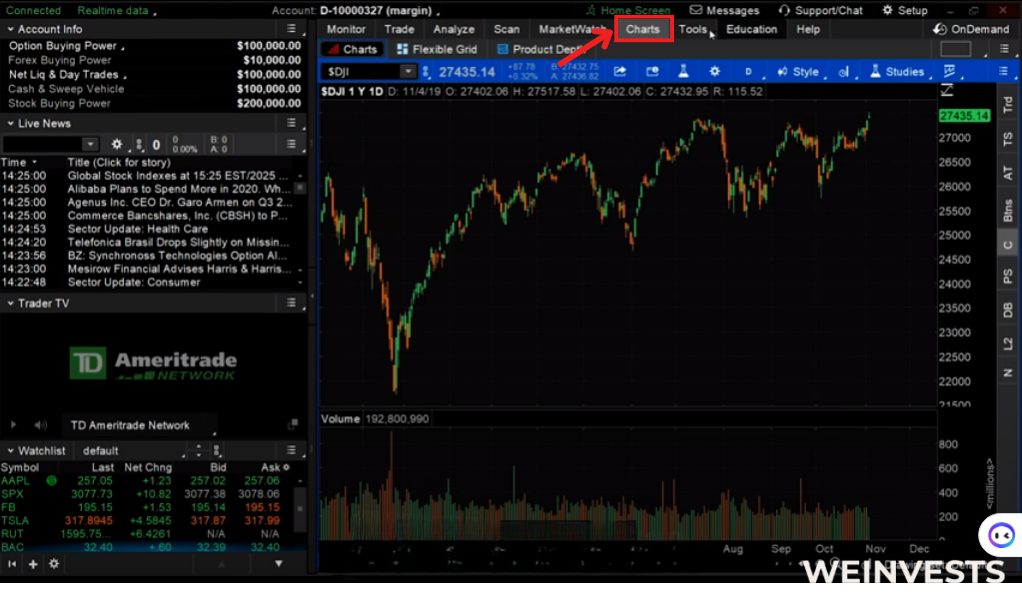
- Open a new chart: Click on the “Charts” tab and enter the ticker symbol of the financial instrument you want to analyze in the “Symbol” input box.
- Add the MACD and ROC indicators to the chart:
a. Click the “Studies” button at the top of the platform, then select “Add Study” > “All Studies” > “M” > “MACD” to add the Moving Average Convergence Divergence to the chart.
b. Click the “Studies” button again, then select “Add Study” > “All Studies” > “R” > “RateOfChange” to add the Rate of Change (ROC) to your chart.
- Customize the MACD settings: Click the “Studies” button, select “Edit Studies,” and find the MACD indicator in the “Studies” section. Click the gear icon to adjust the parameters for the short-term EMA (default 12), long-term EMA (default 26), and Signal Line EMA (default 9) to match your trading preferences. Click “OK” and “Apply” to save the changes.
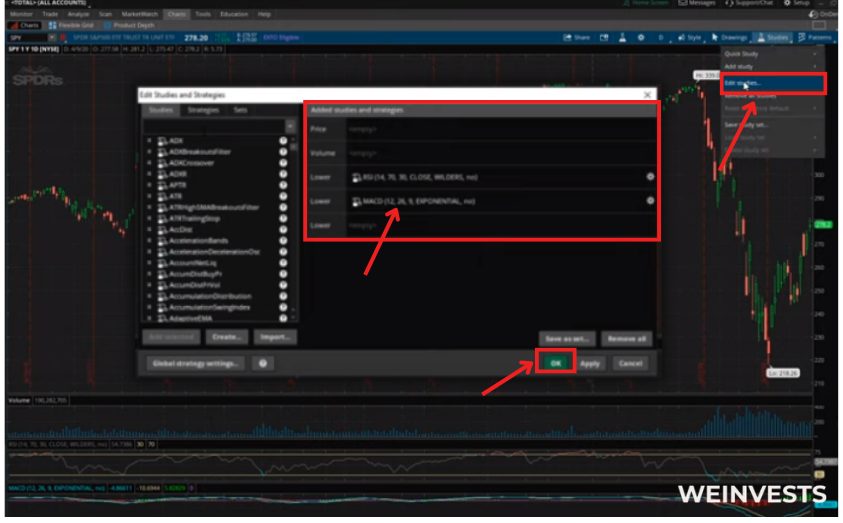
- Customize the ROC settings: Repeat the process for the ROC indicator, adjusting the parameters for the lookback period (default 14) to match your trading preferences. Click “OK” and “Apply” to save the changes.
- Analyze the Impulse MACD signals on the chart: Visually combine the MACD Histogram and ROC signals to identify buy, sell, and neutral conditions:
a. Buy Signal: The MACD Histogram is above 0, and the ROC is positive.
b. Sell Signal: The MACD Histogram is below 0, and the ROC is negative. c. Neutral: The MACD Histogram and ROC signals conflict. - Execute trades based on the Impulse MACD signals: Place buy or sell orders on thinkorswim according to the signals generated by combining the MACD Histogram and ROC, following your trading strategy and risk management principles.
By following these steps, you can effectively use the Impulse MACD Formula on the thinkorswim platform for trading. Remember to conduct thorough research and consider practicing with a demo account before risking real capital.
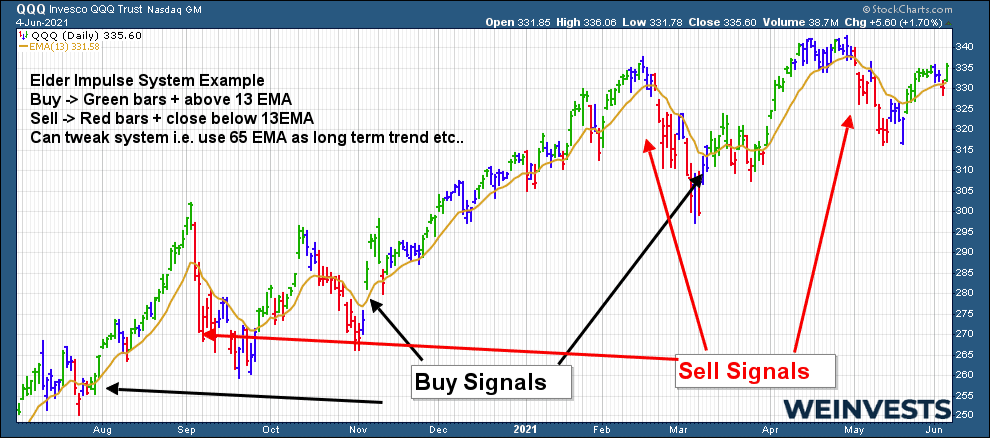
Elder Impulse System
The Elder Impulse System is a trading strategy developed by Dr. Alexander Elder, which combines two indicators, the Exponential Moving Average (EMA) and the MACD Histogram, to identify trend strength and potential trade entry points. Here’s a step-by-step guide for implementing the Elder Impulse System:
- Choose a trading platform or charting tool that supports the Elder Impulse System (e.g., TradingView, MetaTrader).
- Select a financial instrument to analyze and trade.
- Add a 13-period EMA to the price chart: On most platforms, click the “Indicators” button, find “Moving Average” or “Exponential Moving Average,” and set the period to 13.
- Add the MACD Histogram with default settings (short-term EMA: 12, long-term EMA: 26, Signal Line EMA: 9) by clicking the “Indicators” button and searching for “MACD” or “Moving Average Convergence Divergence.”
- Interpret the Elder Impulse System signals:
a. Buy Signal: Price closes above the 13-period EMA and the MACD Histogram is positive.
b. Sell Signal: Price closes below the 13-period EMA and the MACD Histogram is negative.
c. Neutral: The EMA and MACD Histogram signals conflict or are too weak.
6. Execute trades based on the Elder Impulse System signals, adhering to your trading strategy and risk management principles.
Impulse MACD Python
To implement the Impulse MACD Formula using Python, follow this step-by-step guide:
- Install Python and necessary libraries: Install Python, pandas, and TA-Lib using pip or Anaconda.
- Import the required libraries in your Python script:javascriptCopy code
import pandas as pd import numpy as np import talib - Obtain historical price data for the financial instrument you want to analyze, using data providers like Yahoo Finance, Quandl, or Alpha Vantage. Import the data into a pandas DataFrame.
- Calculate the MACD, Signal Line, and Histogram values using the TA-Lib library:cssCopy code
macd, signal, hist = talib.MACD(data['Close'], fastperiod=12, slowperiod=26, signalperiod=9) - Calculate the ROC using the pandas library:scssCopy code
roc = data['Close'].pct_change(periods=14) - Combine the MACD Histogram and ROC signals to generate Impulse MACD signals:csharpCopy code
impulse_signals = np.where((hist > 0) & (roc > 0), 'Buy', np.where((hist < 0) & (roc < 0), 'Sell', 'Neutral')) - Use the generated Impulse MACD signals to inform your trading decisions, following your strategy and risk management principles.
Impulse MACD TradingView
To set up Impulse MACD on TradingView, follow the steps below:
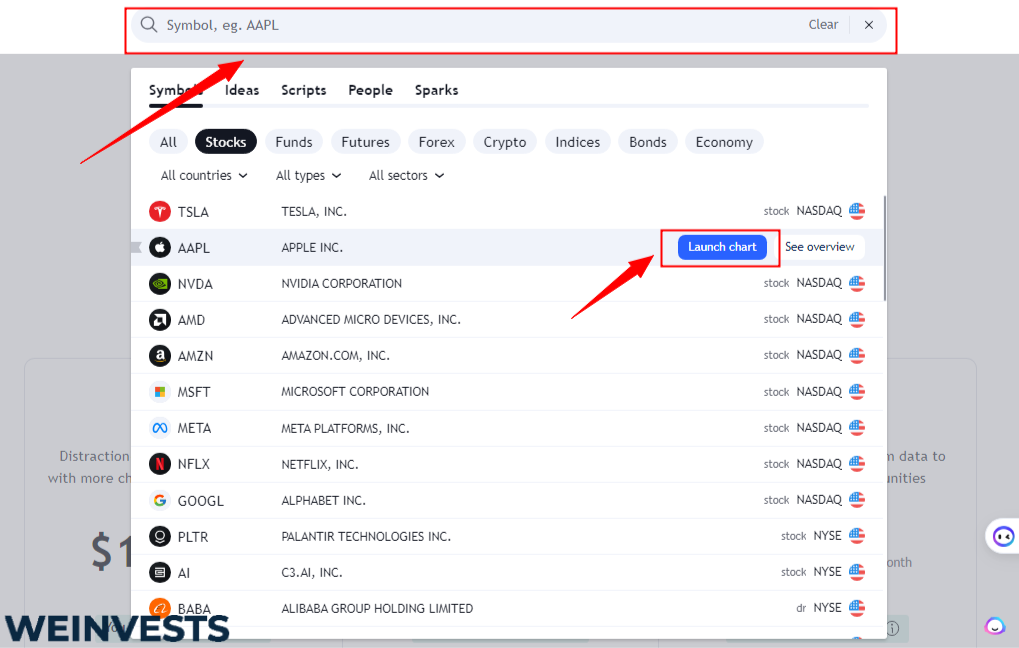
- Sign up or log in to your TradingView account.
If you don’t have a TradingView account, sign up for a free one at https://www.tradingview.com/. If you already have an account, log in to access the platform.

- Open a chart.
After logging in, open a new chart by clicking on the “Chart” tab in the top left corner of the screen. You can search for a specific asset or choose from your watchlist. Once you’ve selected an asset, its price chart will be displayed.
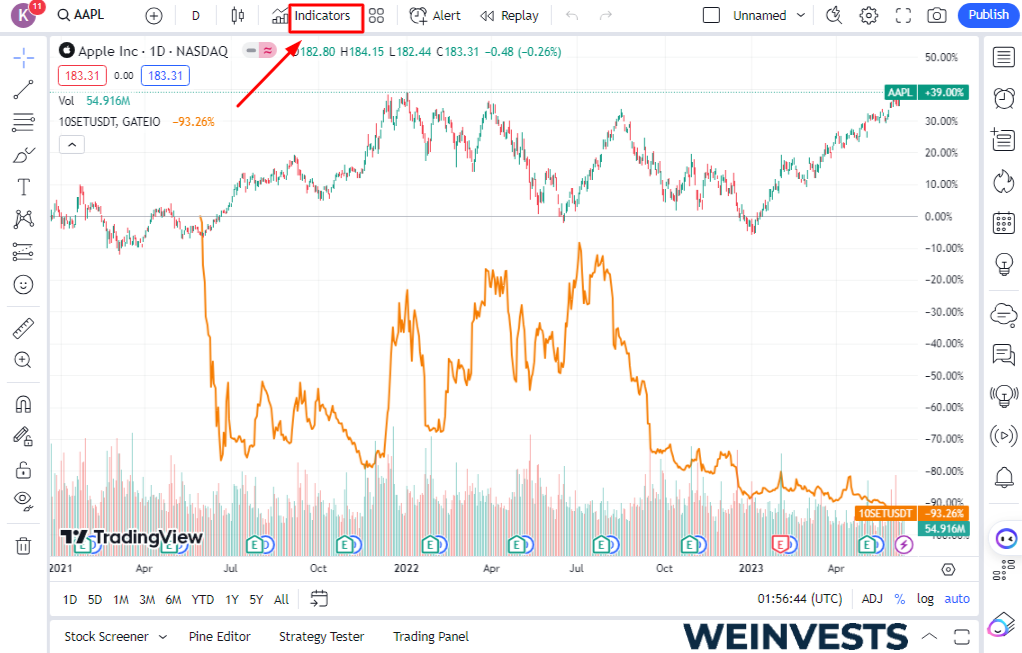
- Access the Public Library.
To add the Impulse MACD indicator, click on the “Indicators” icon at the top of the screen. It looks like a small flask. This will open the “Indicators & Strategies” window.
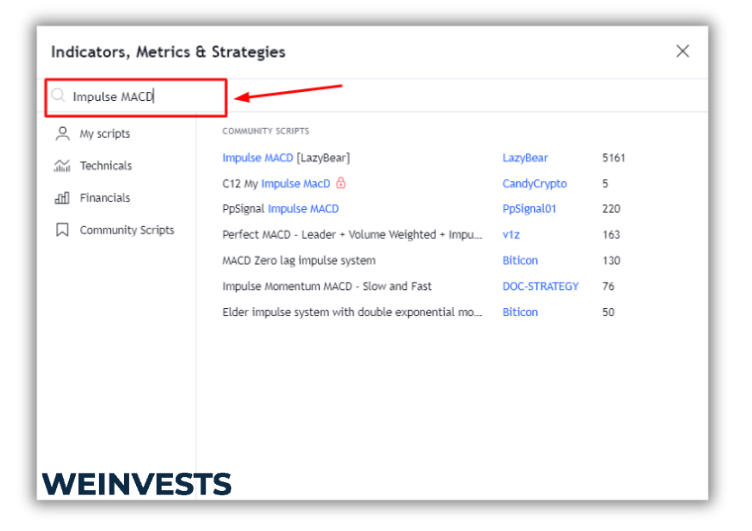
- Search for “Impulse MACD.”
In the “Indicators & Strategies” window, click on the “Public Library” tab. In the search bar, type “Impulse MACD” and hit Enter. You will see a list of custom-built indicators with the name Impulse MACD.
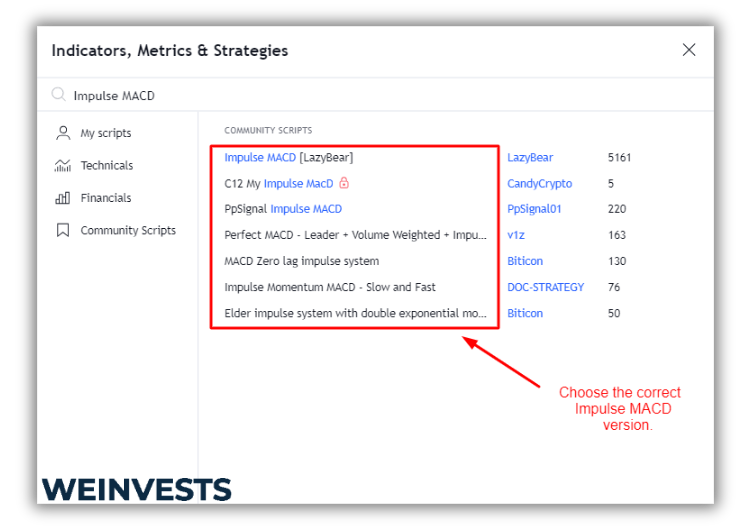
- Choose the correct Impulse MACD version.
Find the Impulse MACD version you want to use. There might be different versions created by various users, so look for one with high ratings and positive reviews. Once you’ve found the right version, click on it to add it to your chart.
- Customize the Impulse MACD settings (optional).
Once the Impulse MACD indicator is added to your chart, you can customize its settings. To do this, click on the gear icon next to the indicator’s name in the chart’s upper-left corner. This will open the “Settings” window for Impulse MACD.
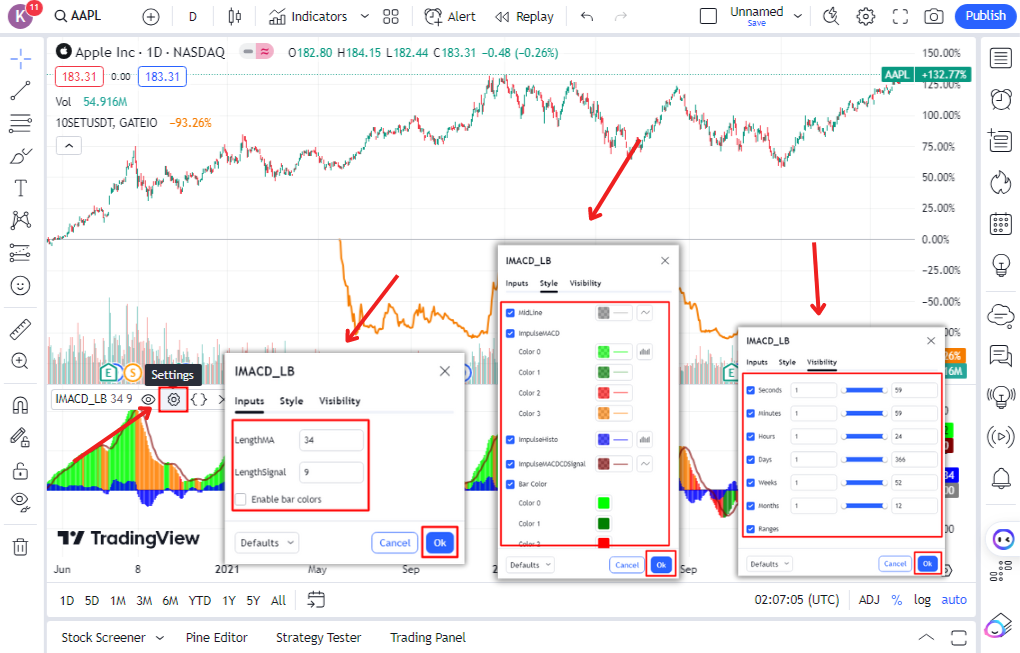
Here, you can adjust parameters such as the short and long-term Exponential Moving Averages (EMA) periods, the Signal line period, and the color of the impulse moves. Remember to click “OK” to save your changes.
- Analyze the Impulse MACD signals.
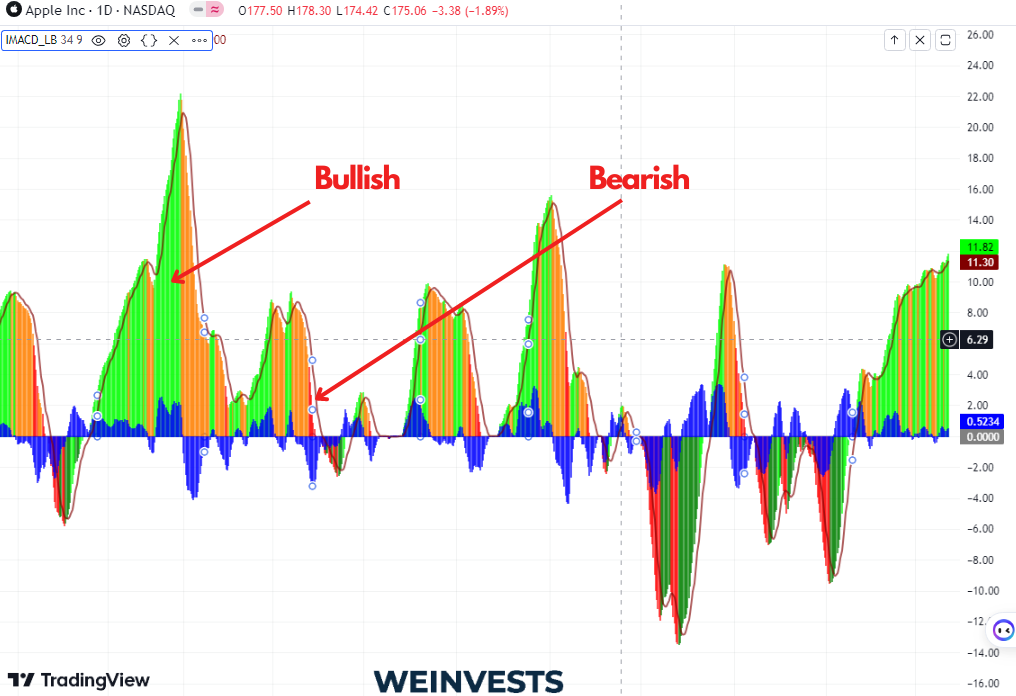
The Impulse MACD indicator will display histogram bars and a signal line. Positive histogram bars (usually green) indicate bullish impulse moves, while negative bars (usually red) indicate bearish impulse moves. The signal line can help confirm these moves and generate potential entry and exit signals.
- Combine Impulse MACD with other indicators (optional).
Impulse MACD can be more effective when used in conjunction with other technical analysis tools or indicators. For example, you can use trend lines, support and resistance levels, and other indicators like RSI or Stochastic Oscillator to get a more comprehensive view of the market and improve your trading decisions.
Remember that no indicator is foolproof, and it’s essential to use proper risk management and develop a trading strategy that suits your style and risk tolerance. Always test your strategy using historical data or a demo account before committing to real trades.
Impulse MACD [LazyBear] – TradingView
The Impulse MACD [LazyBear] is a custom indicator for TradingView that shows the trend direction and momentum of a financial asset using the MACD and a histogram.
To use this indicator, you need to follow these steps:
- Open TradingView and select the chart of the asset you want to analyze.
- Click on the Indicators button at the top of the chart and search for Impulse MACD [LazyBear].
- Click on the indicator name to add it to your chart. You can adjust the settings of the indicator by clicking on the gear icon next to its name.
- The indicator will display two lines: the MACD line (blue) and the signal orang, The histogram (green or red) shows the difference between the two lines.
- The trend direction is determined by the color of the MACD line: blue for bullish and orange for bearish. The momentum is determined by the color and size of the histogram: green for positive and red for negative.
- You can use this indicator to identify trend changes, divergence, convergence, and entry and exit points for your trades.
Here is an example of how to use this indicator in a code block:
//@version=4
study("Impulse MACD [LazyBear]", shorttitle="IMACD_LB")
// Inputs
fastLength = input(12)
slowLength=input(26)
signalLength=input(9)
histColor = input(true, title="Color Histogram based on MACD color?")
// Calculation
fastMA = ema(close, fastLength)
slowMA = ema(close, slowLength)
macd = fastMA - slowMA
signal = sma(macd, signalLength)
hist = macd - signal
// Plotting
plot(macd, color=(macd >= 0 ? color.blue : color.orange), title="MACD")
plot(signal, color=color.gray, title="Signal")
plot(hist, style=plot.style_columns, color=(histColor ? (macd >= 0 ? color.green : color.red) : (hist >= 0 ? color.green : color.red)), title="Histogram")
How to filter MACD false signals
False signals generated by the MACD can lead to suboptimal trading decisions. Here are some steps to filter out false signals:
- Use higher timeframes for analysis, as they often provide more reliable signals (e.g., daily or weekly charts instead of hourly charts).
- Combine MACD signals with other indicators, such as the RSI (Relative Strength Index), Stochastic Oscillator, or trend lines, to confirm the signals. For example, you could require both the MACD and RSI to show a buy signal before entering a trade.
- Use price action analysis, including support and resistance levels, to validate MACD signals. For instance, if the MACD gives a buy signal near a strong resistance level, you may want to wait for a breakout before entering the trade.
- Apply a MACD Signal Line filter, only taking trades when the MACD line is above or below the Signal Line by a certain threshold. This can help reduce the number of false signals generated by minor fluctuations.
- Employ a risk management strategy to protect your capital from adverse market movements caused by false signals. This can include using stop-loss orders, position sizing, and diversifying your trades across different financial instruments.
Impulse Trading Tool
Impulse trading tools are essential resources for traders who aim to capitalize on impulsive market moves. These tools help identify strong momentum and directional shifts in price, offering potential profit opportunities when used correctly. This mini guide will provide an overview of various impulse trading tools and explain how they can be applied to improve your trading decisions.
List of Tools and Explanations:
- Impulse MACD Formula: The Impulse MACD Formula combines the MACD Histogram and the Rate of Change (ROC) indicator to generate buy, sell, or neutral signals based on market momentum and direction. When both the MACD Histogram and ROC are positive, a buy signal is generated. Conversely, when both are negative, a sell signal is generated.
- Elder Impulse System: Developed by Dr. Alexander Elder, this system combines the Exponential Moving Average (EMA) and the MACD Histogram to identify trend strength and potential trade entry points. Buy signals occur when the price closes above the EMA, and the MACD Histogram is positive, while sell signals occur when the price closes below the EMA, and the MACD Histogram is negative.
- Relative Strength Index (RSI): The RSI is a momentum oscillator that measures the speed and change of price movements. RSI values range from 0 to 100, with levels above 70 indicating overbought conditions and levels below 30 indicating oversold conditions. Traders can use the RSI to identify potential impulsive moves when the indicator crosses these threshold levels or when it shows divergence with price action.
- Stochastic Oscillator: This momentum indicator compares a security’s closing price to its price range over a specified period. The Stochastic Oscillator generates buy and sell signals when it crosses above or below its signal line or when it reaches overbought or oversold levels. Impulsive moves can be identified by monitoring these crossovers and extreme levels.
- Moving Average Convergence Divergence (MACD): The MACD is a trend-following momentum indicator that shows the relationship between two moving averages of a security’s price. Buy and sell signals are generated when the MACD line crosses above or below its signal line, respectively. Traders can use the MACD to identify impulsive moves by monitoring these crossovers and confirming them with other indicators or price action analysis.
Conclusion
By incorporating impulse trading tools into your trading strategy, you can improve your ability to identify high-probability trading opportunities and make better-informed decisions in the markets. It’s essential to understand the underlying concepts of each tool and practice using them in conjunction with a sound risk management plan. Ultimately, the key to successful impulse trading lies in finding the right combination of tools that align with your trading style and objectives.
Identifying a Ranging Market
Ranging markets are characterized by a period of sideways price movement within a specific price range. This lack of clear trend direction can make it difficult for traders to determine profitable trading signals using traditional indicators. For Instance, if BTC has been trading between a certain level for weeks, that could be categorized as a ranging market. While the traditional MACD indicator is a trend-following indicator. Impulse MACD can help you time short price movements to better your chances of making small profits in a ranging market.
How To Trade Ranging Markets With Impulse MACD
Impulse MACD, a popular trading indicator, can be a powerful tool for identifying and trading in ranging markets. By visualizing the market conditions using Impulse MACD, traders can easily identify when the market is range-bound. A horizontal line on the indicator chart indicates that the market is neither overbought nor oversold, making it a perfect time to use Impulse MACD’s unique features to identify potential entry and exit points, maximizing profit potential in the ranging market.
Here’s an example of how Impulse MACD can be useful in identifying ranging markets. Suppose the price action of a particular currency pair has been moving between $11000 and $11300 for some time. Traders can use Impulse MACD to confirm that the market is ranging by looking for a flat horizontal line on the indicator chart. With the market now identified as ranging, traders can then use Impulse MACD to identify opportunities, such as buying when the price is near the bottom of the range and selling when it is at the top, and vice versa.
Setting up Impulse MACD on Your Trading Chart
If you want to incorporate Impulse MACD into your trading strategy, the first step is to set it up on your trading chart. Fortunately, Impulse MACD is available on most trading platforms, including MetaTrader4 and TradingView, among others. To install Impulse MACD, navigate to the indicator library on your platform and search for it by name. Once you find it, simply click the button to add it to your chart.
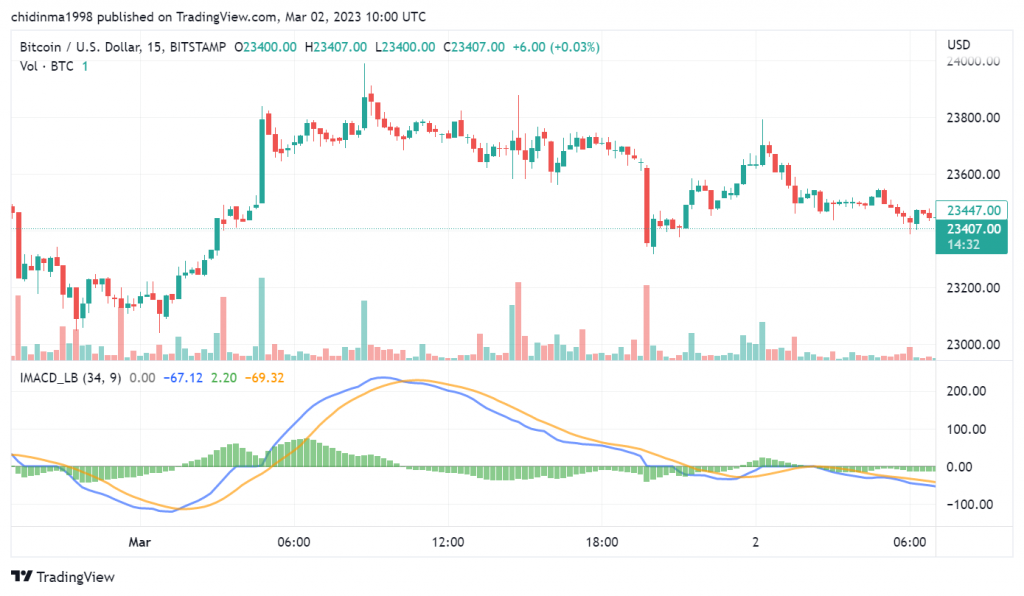
While it is easy to apply Impulse MACD to a chart, configuring it for optimal performance may take some practice. One of the most important considerations is the time frame you are trading on. The default settings may not be appropriate for all time frames, and tuning the parameters to the specific market you are trading can be critical to success. Experiment with the different settings and study the results to determine the ideal parameters that work for you.
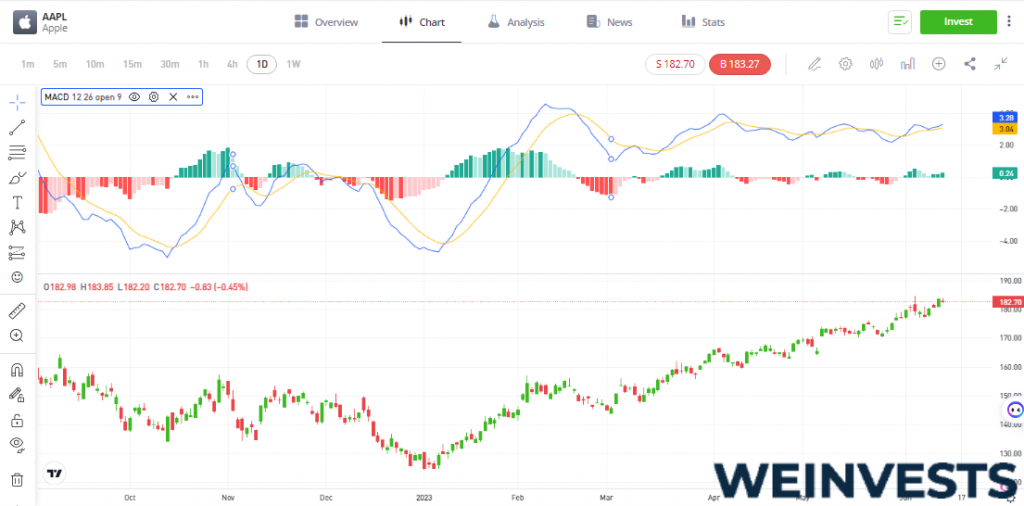
Here’s an example of the impulse MACD indicator applied to a BTC/USD chart;
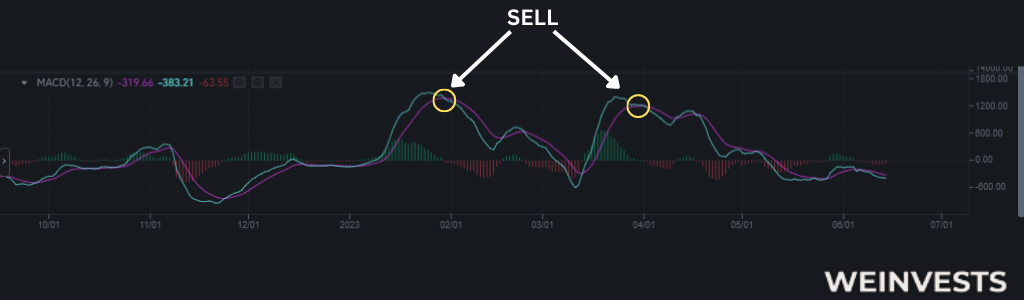
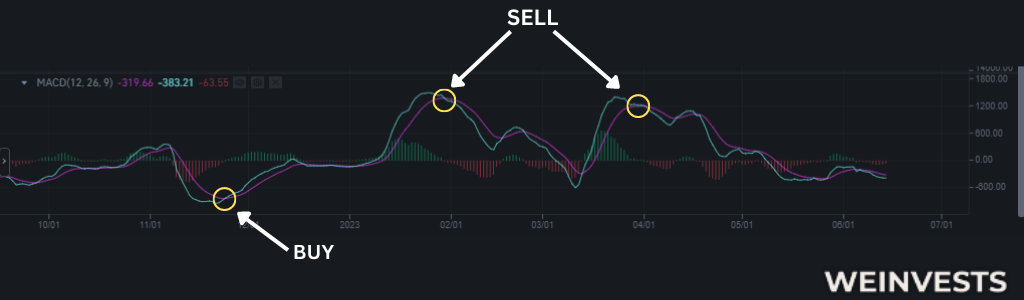
How to Identify Entry and Exit Points With Impulse MACD
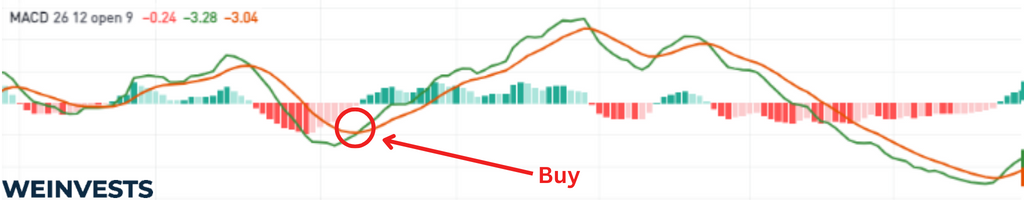
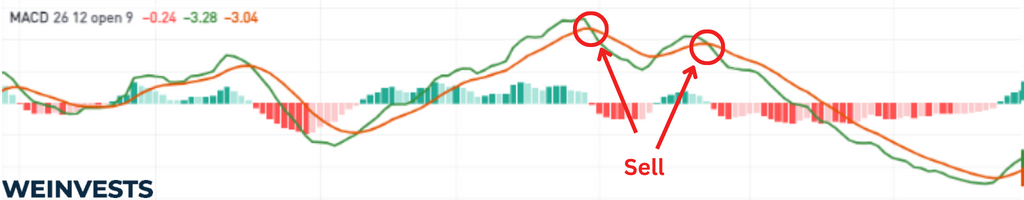
One of the key benefits of using Impulse MACD as a trading indicator is its ability to identify entry signals in ranging markets. A ranging market is a market that moves sideways with no clear direction. In this type of market, it can be difficult to identify when to enter or exit a trade. By using Impulse MACD, traders can spot entry signals based on the crossover of the MACD line and the signal line. When the MACD line crosses above the signal line, it is a bullish signal, indicating that it may be a good time to enter a long position. Conversely, when the MACD line falls below the signal line, it is a bearish signal, indicating that it may be a good time to enter a short position.
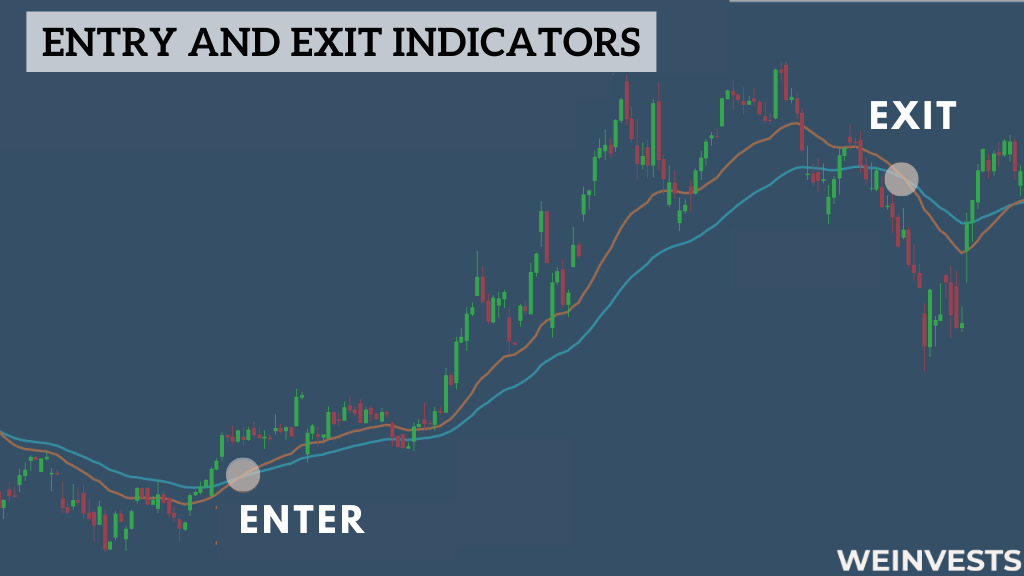
Once a trader has entered a trade, they can also use Impulse MACD to confirm exit signals. In a ranging market, it can be difficult to identify when to close a trade, as there may be no clear direction for the market to move in. Using Impulse MACD, traders can look for signals that the market is starting to move in the opposite direction. For example, if a trader has entered a long position, they can look for a bearish crossover in the MACD lines as a signal to exit the trade.
When using Impulse MACD to manage stop loss and take profit levels, traders can use the signal line as a guide. The signal line shows the average of the MACD line over a set period of time and can be a helpful tool for determining where to place stop loss and take profit orders. For example, if a trader has entered a long position and the MACD line is above the signal line, they may place their stop loss below the signal line as a way to limit their losses if the market moves against them. Similarly, if the MACD line is below the signal line, a trader may place their take profit order above the signal line to take profits if the market moves in their favor.
Using Impulse MACD With Other Indicators
When trading with Impulse MACD, it is essential to confirm the signals with other indicators. This is because no single indicator can provide a complete picture of the market. Examples of other indicators traders use to confirm Impulse MACD signals include;
Relative Strength Index (RSI)
The RSI is a momentum oscillator that measures the speed and change of price movements. It oscillates between 0 and 100 and is considered overbought when it is above 70 and oversold when it is below 30. When the Impulse MACD generates a buy signal, traders can look for confirmation from the RSI moving above the oversold level or crossing the 50 levels. Similarly, when the Impulse MACD generates a sell signal, traders can look for confirmation from the RSI moving below the overbought level or crossing the 50 levels.
Moving Averages (MA)
Combining moving averages with the Impulse MACD can also provide stronger signals. For example, traders can use a simple moving average (SMA) and the Impulse MACD to generate buy signals when the price is above the SMA, and the Impulse MACD is above zero. Conversely, traders can use the SMA and the Impulse MACD to generate sell signals when the price is below the SMA, and the Impulse MACD is below zero. By combining indicators, traders can increase their confidence in the signals and improve their trading results.
Tips to Manage Risk and Maximize Profits with Impulse MACD

Impulse MACD is a powerful trading indicator that can help manage risk and reduce losses. It can provide clear signals for entry and exit points in ranging markets, making it easier to avoid false breakouts and whipsaws. When trading with this indicator, traders should take note of these strategies to maximize their position and profit more.
- Position sizing and money management techniques can be used to manage risk with Impulse MACD.
- Another strategy is to allocate a fixed percentage of trading capital to each position or use stop-loss orders to limit potential losses.
- Realistic profit targets should be set when trading with Impulse MACD signals.
- Trailing stop-loss orders can be used to lock in profits as the market moves in favor or take partial profits at predetermined levels.
Combining these risk management strategies with a solid understanding of the Impulse MACD indicator can improve traders’ chances of success in ranging markets.
Conclusion
Mastering Impulse MACD is an essential skill for traders who operate in ranging markets. With its unique combination of trend and momentum analysis, Impulse MACD can help traders identify profitable entry and exit points with high accuracy. By applying and configuring this indicator, as well as using it in conjunction with other indicators to confirm signals, traders can maximize profits while minimizing risk in different markets and conditions. By implementing the tips and techniques presented here, traders can improve their performance by relying on a powerful trading indicator that is easy to use and understand.
FAQ
What is Impulse MACD?
Impulse MACD is a technical indicator that helps traders make decisions when the market condition is ranging or sideways. It also helps them determine when they should enter into a trade, as well as when they should exit out of one.
Does Impulse MACD work with other indicators?
Yes. The Relative Strength Index (RSI) and Stochastic indicators are two common tools that traders use to confirm Impulse MACD signals.
How to use Impulse MACD?
Impulse MACD is best suited for ranging markets. It helps traders identify short-term price movements more accurately than the traditional MACD, which is works in a trending markets.
WeInvests is a financial portal-based research agency. We do our utmost best to offer reliable and unbiased information about crypto, finance, trading and stocks. However, we do not offer financial advice and users should always carry out their own research.
Read More