This content represents the writer’s opinions and research and is not intended to be taken as financial advice. The information presented is general in nature and may not meet the specific needs of any individual or entity. It is not intended to be relied upon as a professional or financial decision-making tool.
In the world of finance, understanding market trends and predicting future price movements are vital. Traders rely heavily on various technical indicators to aid their decision-making process.
One of the most popular and widely used indicators is the Moving Average Convergence/Divergence (MACD). Designed by Gerald Appel in 1978, the MACD is a trend-following momentum indicator that reveals changes in the strength, direction, momentum, and duration of a trend in a stock’s price.
This comprehensive guide provides a step-by-step walkthrough of the MACD, demystifying its components, calculations, and how to effectively use it in your trading strategies.
Table of Contents
- What is MACD?
- MACD Indicator on Trading View
- MACD Indicator on eToro
- Calculating the MACD Indicator
- Interpreting the MACD Indicator
- Best Indicator to use with MACD
- MACD False Signals
- Trading Strategies with the MACD Indicator
- MACD Best Time Frame
- To ensure the best use of the MACD indicator, consider these tips:
- Key Takeaways
- Conclusion
What is MACD?
The MACD is part of a class of indicators known as momentum oscillators, which measure the speed and direction of price movements. It operates on the principle of moving averages, giving traders a quantified view of the momentum behind market movements. The MACD comprises four key components: the MACD line, the signal line, the zero line, and the histogram.
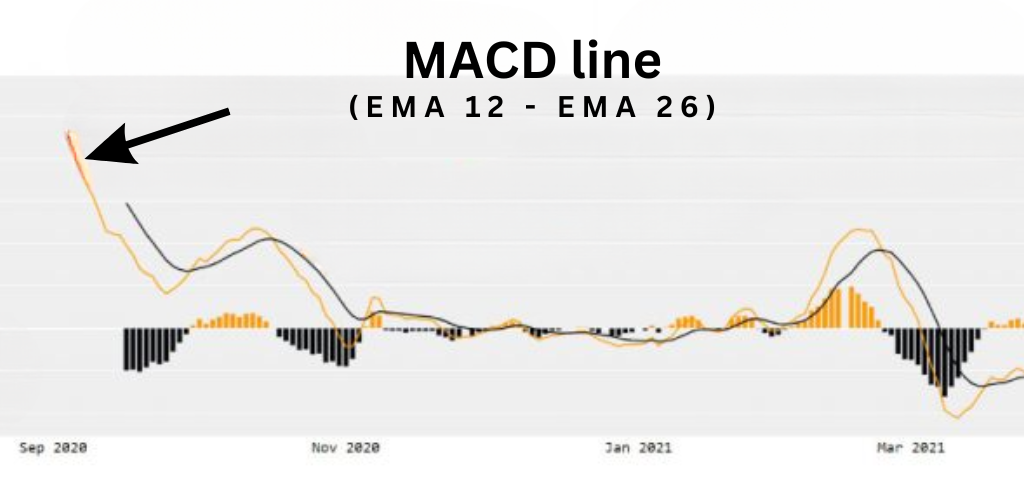
MACD Line: The MACD line is the heart of the indicator, representing the difference between the 12-day Exponential Moving Average (EMA) and the 26-day EMA. It indicates shorter-term trends.
Signal Line: The signal line is the 9-day EMA of the MACD line, revealing long-term trends. This line reacts slower to price changes compared to the MACD line.
Zero Line: This is the center point of the MACD indicator. When the MACD line crosses the zero line, it indicates a change in trend.
MACD Histogram: The MACD Histogram illustrates the difference (or divergence) between the MACD line and the signal line. It serves as a strong visual tool to perceive when bullish or bearish momentum is high.
MACD Indicator on Trading View
- Open TradingView: Open your web browser and visit the TradingView website. If you haven’t registered yet, you will need to create an account to access the platform.

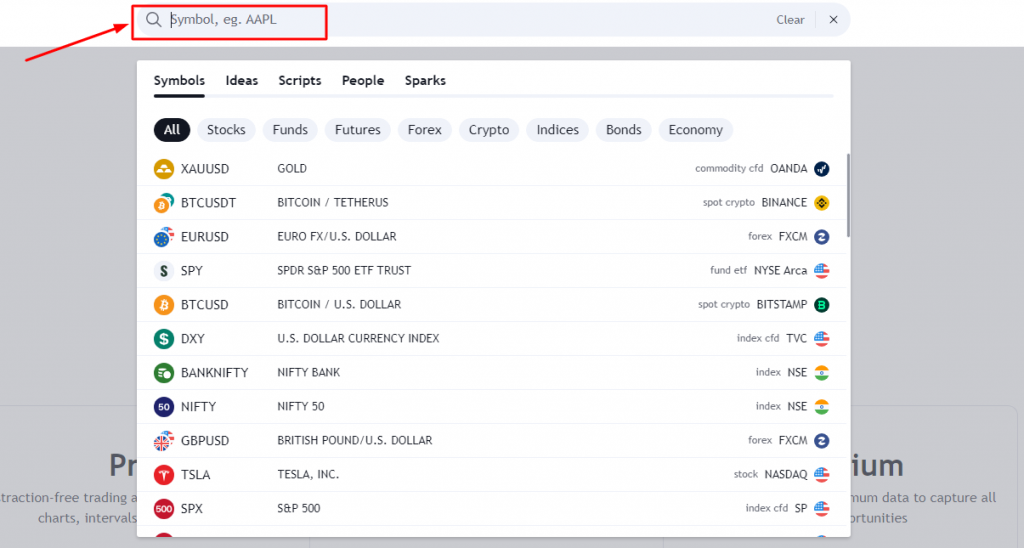
- Select an Asset: From the dashboard, find the search bar at the top of the screen. Input the ticker symbol for the asset you’re interested in, then press ‘Enter’. Click on the correct search result to load the asset’s price chart.
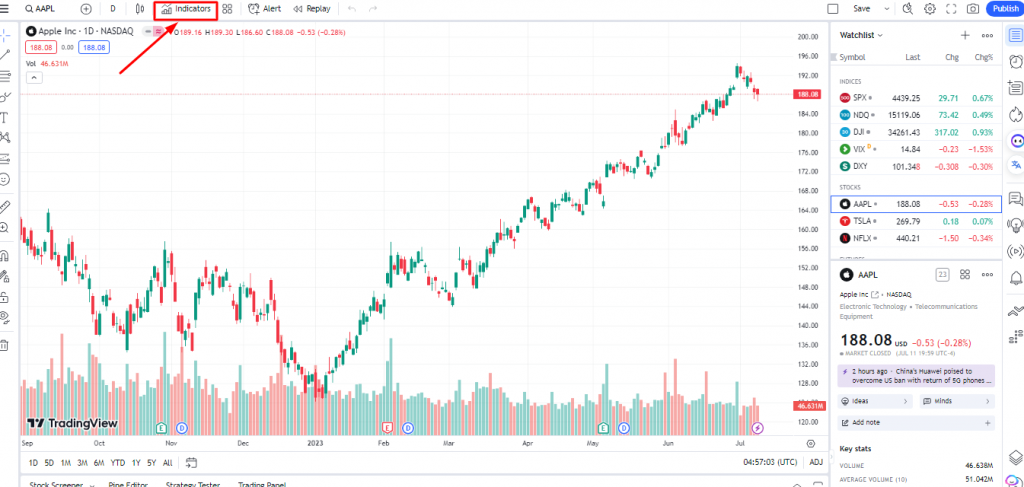
- Access Indicators: Above the price chart, there is a toolbar with various options. Click on the “Indicators” or “Fx” button.
- Search for MACD: In the search bar of the new window that opens up, type in “MACD”. The full name of the indicator is “Moving Average Convergence Divergence”. Click on it to add it to your chart.
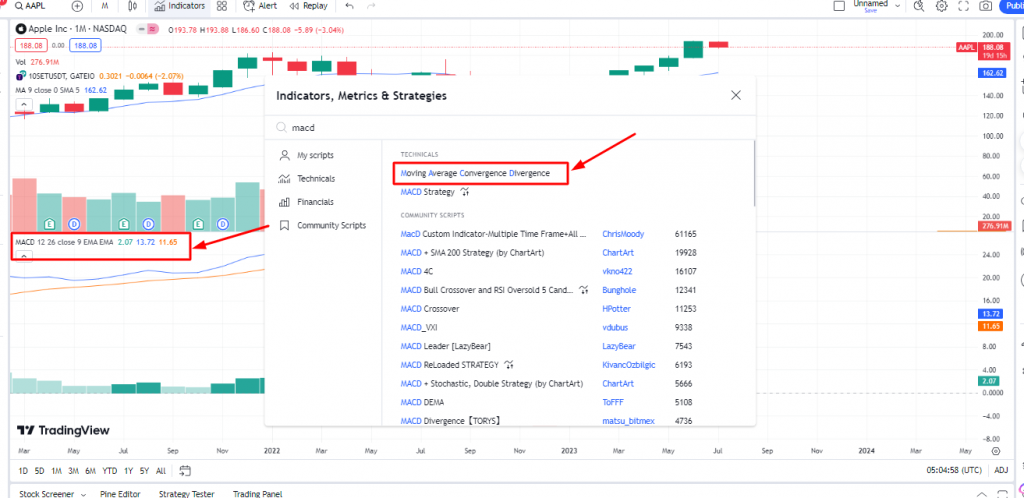
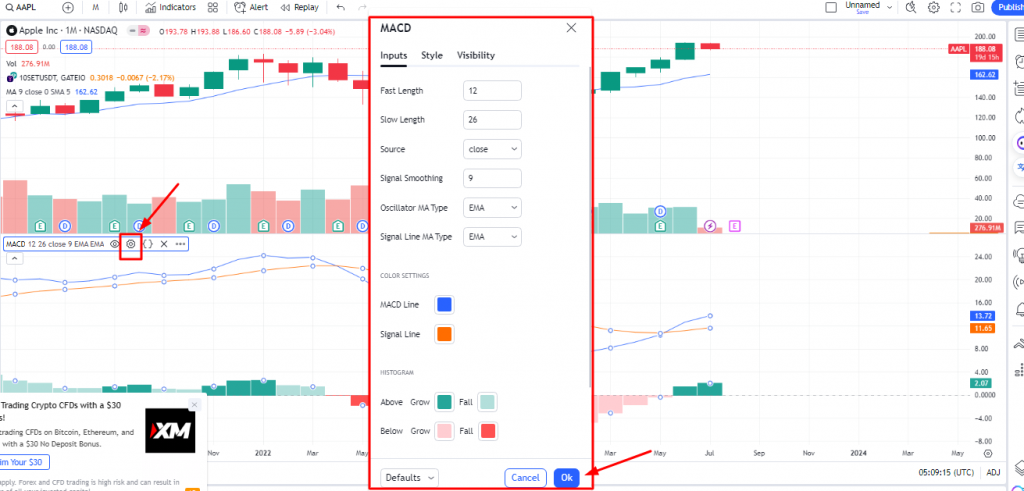
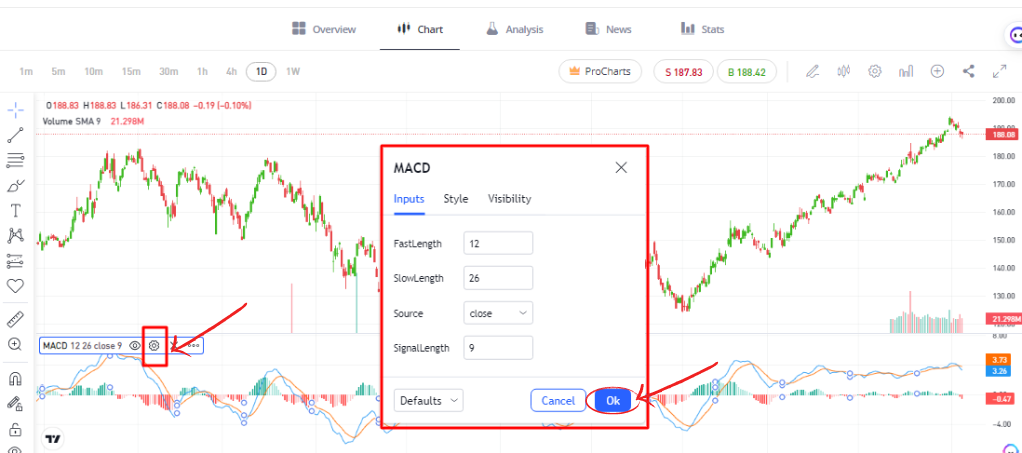
- Adjust Settings (if required): By default, the MACD indicator in TradingView uses 12 for the fast length (short-term), 26 for the slow length (long-term), and 9 for the signal smoothing. To change these parameters, click on the gear icon next to the MACD label above your chart. Adjust the numbers as needed, then click “OK”.
- Interpret the MACD Indicator: The MACD indicator consists of two lines and a histogram. The MACD line (usually blue) is the difference between the 12-period EMA and the 26-period EMA. The Signal line (usually orange) is a 9-period EMA of the MACD line. The histogram represents the difference between the MACD line and the Signal line.
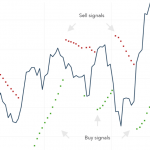
- Buy signal: If the MACD line crosses above the signal line, this is typically seen as a bullish signal, indicating it might be a good time to buy.
- Sell signal: If the MACD line crosses below the signal line, this is typically seen as a bearish signal, indicating it might be a good time to sell.
- Divergence: If the price of the asset is making new highs/lows but the MACD is not, this is called a divergence and could suggest that the trend is weakening.
- Apply the MACD Indicator: The MACD indicator should never be used in isolation. Make sure to use it alongside other technical analysis tools, fundamental analysis, and risk management strategies to make well-informed trading decisions.
MACD Indicator on eToro
- Log in to your eToro account:
Open the eToro platform and sign in using your account credentials.

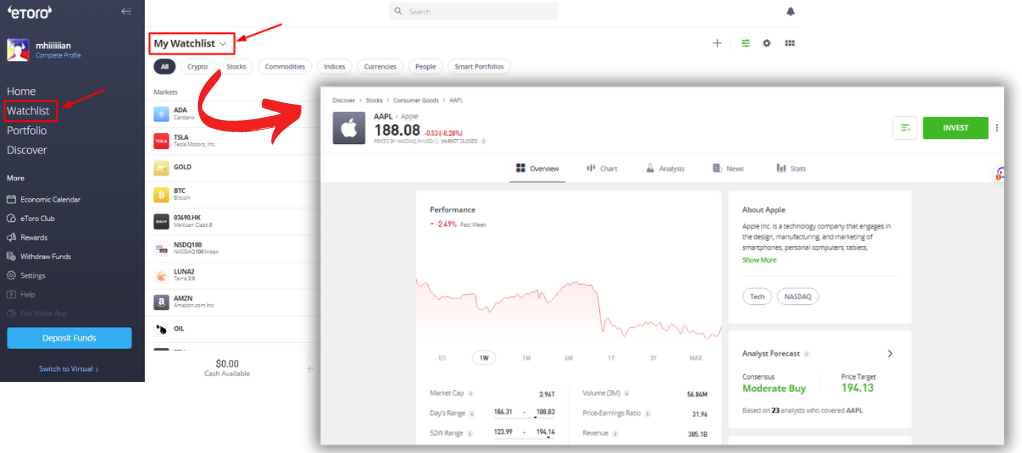
- Select your asset:
On the left side of the screen, you’ll see a ‘Watchlist’ where you can search for the asset you’re interested in. Click on the asset to bring up its chart.
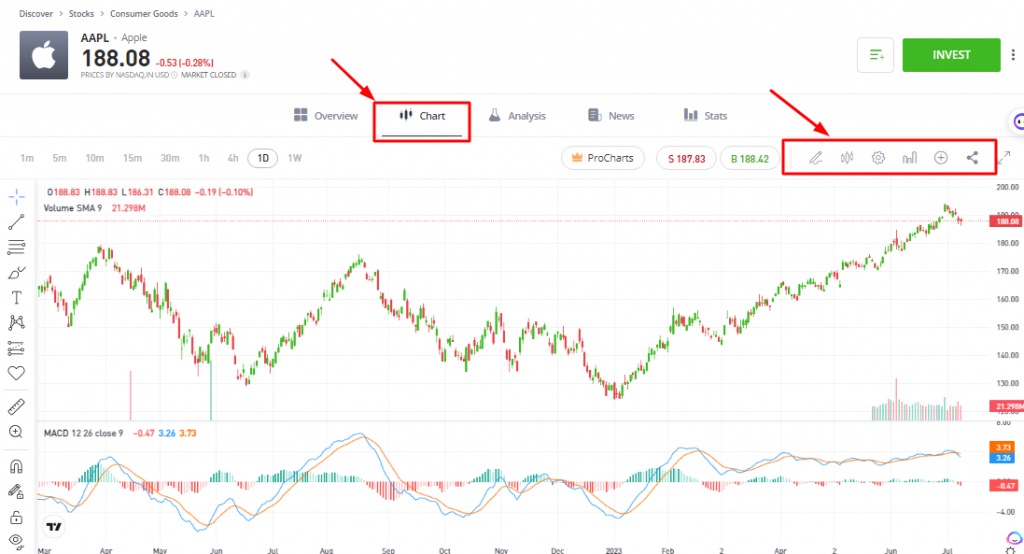
- Access the chart tools: Once the chart for your selected asset appears, look for the ‘Chart Tools’ option. You should find this at the top of the chart interface.
- Add the MACD indicator:
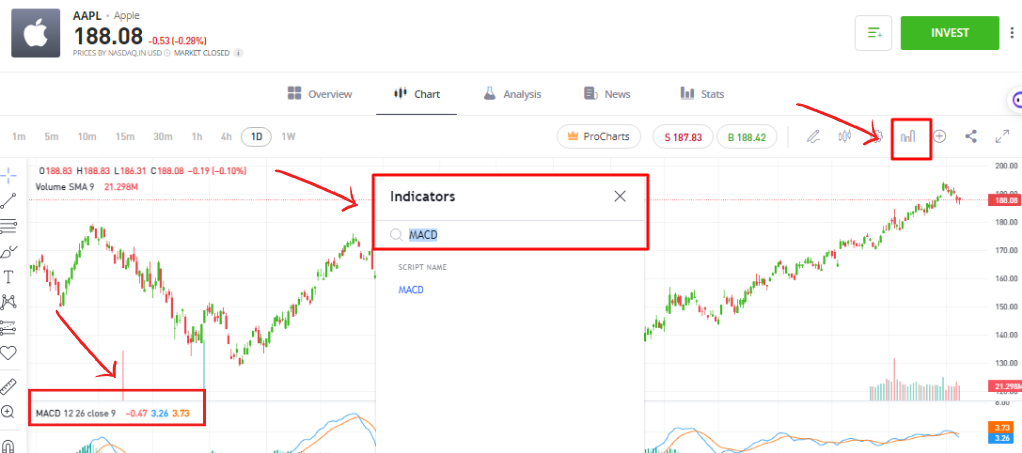
Click on the ‘Studies’ or ‘Indicators’ tab (this may vary depending on the platform’s updates). A dropdown menu will appear. Scroll down the list until you find ‘MACD’. Click on it to add it to your chart.
- Configure the MACD indicator:
By default, the MACD indicator is set to (12,26,9), which means it’s using a 12-period short-term EMA, a 26-period long-term EMA, and a 9-period signal line. If you want to change these settings, click on the ‘Settings’ icon next to the MACD indicator on your chart, make the desired adjustments, and click ‘OK’.
- Interpret the MACD Indicator:
The MACD indicator consists of the MACD line, signal line, and the MACD histogram. Here is how to interpret them:
MACD Line: The MACD line is the heart of the indicator and by default, it’s the difference between the 12-period EMA and the 26-period EMA.
Signal Line: This is a 9-period EMA of the MACD Line.
MACD Histogram: This represents the difference between the MACD line and the Signal line. It’s used to visualize the difference between the two lines.
If the MACD line crosses above the signal line, it’s a bullish signal, which indicates it may be a good time to buy. Conversely, if the MACD line crosses below the signal line, it’s a bearish signal, which might suggest it’s a good time to sell. The histogram can provide a visual representation of when these crossovers are about to happen.
Calculating the MACD Indicator
To gain an accurate understanding of the MACD, it’s crucial to know how it’s calculated. Here is a step-by-step guide on the calculation process:
- Compute the 12-day EMA and 26-day EMA of your asset’s closing prices.
- Subtract the 26-day EMA from the 12-day EMA to calculate the MACD line.
- Generate the signal line by computing the 9-day EMA of the MACD line.
- Subtract the signal line from the MACD line to create the MACD histogram.
The MACD line is calculated by subtracting the 26-day Exponential Moving Average (EMA) from the 12-day EMA. This gives us the formula: MACD Line = 12-day EMA – 26-day EMA.
Let’s break down how to calculate an EMA: An EMA is calculated by first determining the simple moving average (SMA) for a particular period. Then, the multiplier for the EMA is calculated, using the formula [2/(selected time period + 1)]. For example, the multiplier for a 12-day EMA would be 2/(12 + 1) = 0.1538. The EMA is then calculated using the following formula: EMA = (Close – Previous Day’s EMA) * multiplier + Previous Day’s EMA.
To calculate the MACD line, first compute the 12-day EMA and the 26-day EMA of the asset’s closing prices. Then, subtract the 26-day EMA from the 12-day EMA, as per the MACD Line formula mentioned above.
The second part of the MACD indicator is the signal line, which is simply a 9-day EMA of the MACD line itself. To calculate the signal line, take the MACD line data points, compute the 9-day EMA in a similar manner to before, and this will yield the signal line.
Finally, traders often look at the difference between the MACD line and the signal line, which is often displayed as a histogram. This difference can highlight potential market reversals and overbought or oversold conditions. The formula is: MACD Histogram = MACD Line – Signal Line. By calculating and interpreting these three components (MACD Line, Signal Line, and MACD Histogram), traders can use the MACD indicator to identify potential buy and sell signals in the market.
Interpreting the MACD Indicator
Understanding what the MACD indicates is key to utilizing it effectively. When the MACD line crosses above the signal line, it suggests bullish momentum and may be a good time to buy. Conversely, when the MACD line crosses below the signal line, it signals bearish momentum, indicating a potential sell scenario.
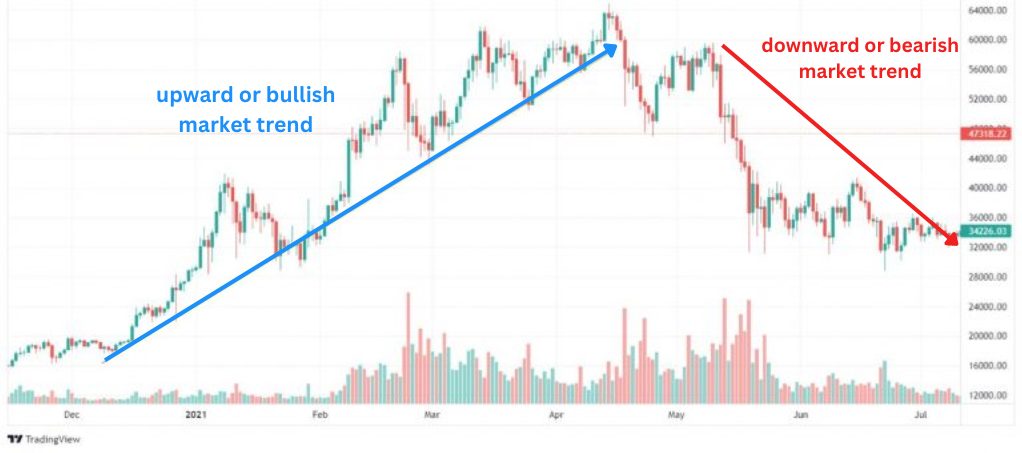
When the MACD line crosses above the zero line, it points to an upward or bullish market trend. When it crosses below the zero line, it indicates a downward or bearish market trend.
The MACD histogram also provides valuable information. When the histogram is positive (above the zero line), it signifies that the MACD line is above the signal line and serves as a bullish confirmation. When it’s negative (below the zero line), it shows that the MACD line is below the signal line, a bearish confirmation.
Best Indicator to use with MACD
The MACD indicator can be effectively combined with several other technical indicators to enhance its reliability and provide more robust trading signals. Here are a few examples:
Relative Strength Index (RSI): The RSI is a momentum oscillator that measures the speed and change of price movements. It’s typically used to identify overbought or oversold conditions in a market.
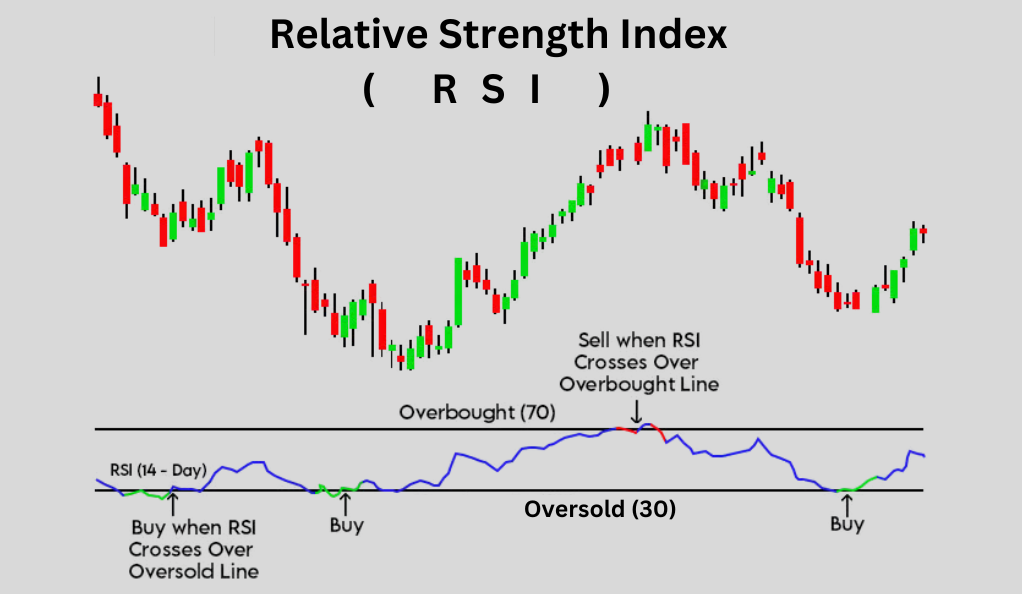
Example: Let’s say you’re using a daily chart and the MACD has just given a bullish signal (the MACD line crossed above the signal line). Before you decide to buy, you also check the RSI. If the RSI is below 30 (indicating an oversold condition), this could provide additional confirmation that it might be a good time to enter a long position. Conversely, if the MACD gives a bearish signal and the RSI is above 70 (indicating an overbought condition), this could confirm that it might be a good time to sell or short.
Bollinger Bands: Bollinger Bands in conjunction with MACD, also known as MACD BB or MACDBB, consist of a middle band (a simple moving average) with two outer bands that are 2 standard deviations away from the middle band. They can help identify volatility and price levels that are overextended.
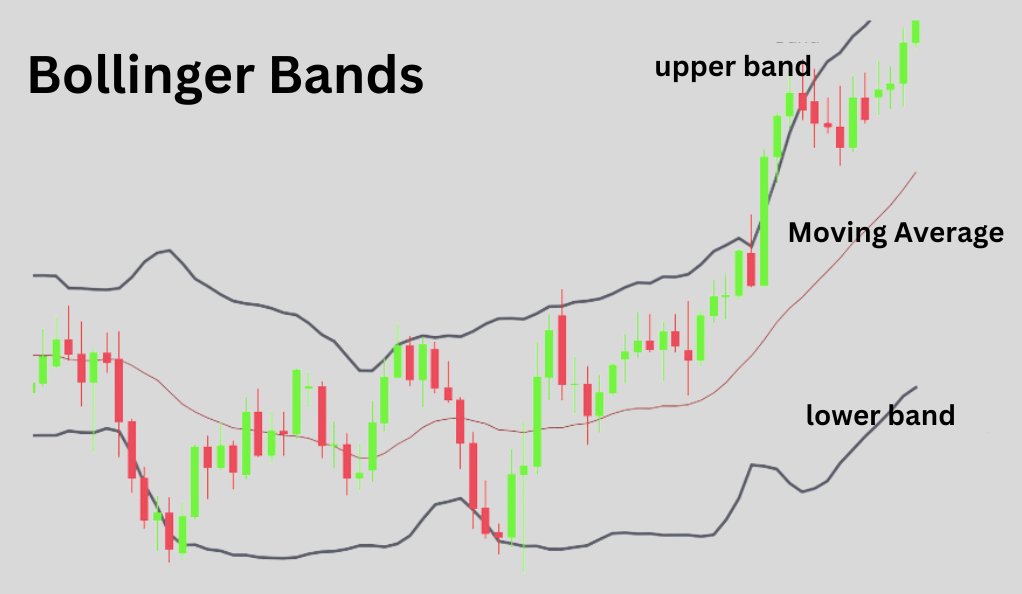
Example: If the MACD gives a bullish signal and the price is near the lower Bollinger Band, this could indicate that the price is oversold and may soon rise, providing additional confirmation for the MACD signal. Conversely, if the MACD gives a bearish signal and the price is near the upper Bollinger Band, this could suggest that the price is overbought and may soon fall.
Here’s a step-by-step guide on how the MACD BB strategy works:
- Identify the Trend Using MACD: The MACD indicator is used to identify the direction of the trend. When the MACD line (the difference between two moving averages) crosses above the signal line (the moving average of the MACD line), it indicates a bullish trend. Conversely, when the MACD line crosses below the signal line, it indicates a bearish trend.
- Use Bollinger Bands to Confirm the Trend Breakout: Bollinger Bands consist of a middle band (a simple moving average) and two outer bands that are standard deviations away from the middle band. When the price breaks through the upper Bollinger Band during a bullish trend, it confirms the trend breakout and could be a good time to enter a long position. Similarly, when the price breaks through the lower Bollinger Band during a bearish trend, it confirms the trend breakout and could be a good time to enter a short position.
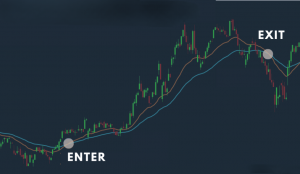
- Entry and Exit Points: A buy signal occurs when the MACD line crosses above the signal line and the price breaks through the upper Bollinger Band. A sell signal occurs when the MACD line crosses below the signal line and the price breaks through the lower Bollinger Band.
- Stop Loss and Take Profit: Stop loss can be set below the lower Bollinger Band for long trades or above the upper Bollinger Band for short trades. Take profit can be set at a previous high for long trades or a previous low for short trades.
Remember, no strategy is foolproof and it’s important to use additional indicators and analysis methods to confirm signals. Always use proper risk management techniques to protect your trading capital.
Moving Averages: Moving averages smooth out price data to identify trends over a certain period. A popular choice is the 50-period and 200-period moving averages.
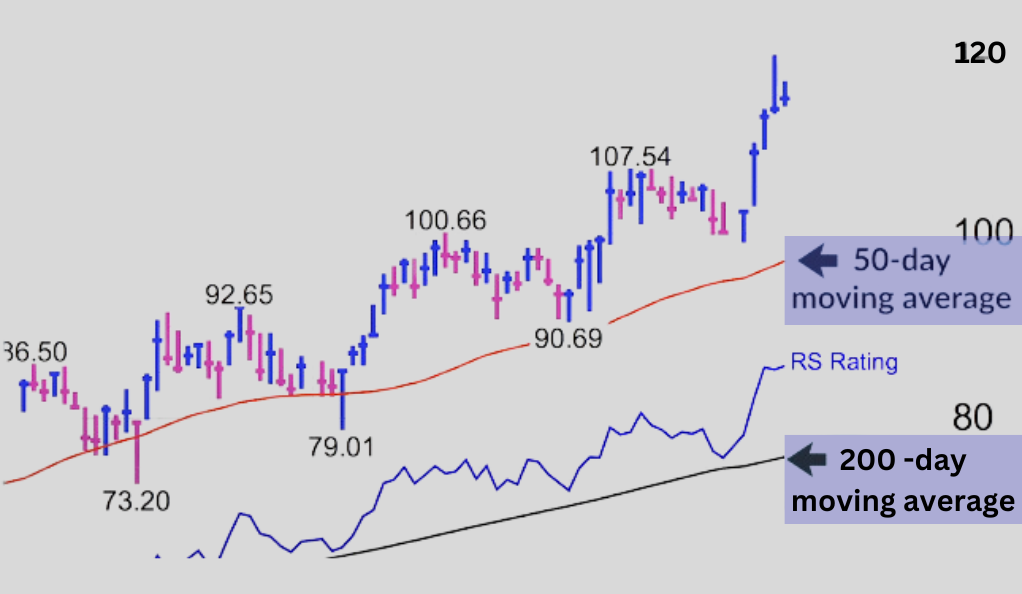
Example: If the MACD gives a bullish signal and the price is above both the 50-period and 200-period moving averages, this could provide additional confirmation of an upward trend.
Conversely, if the MACD gives a bearish signal and the price is below these moving averages, this could confirm a downward trend.
Stochastic Oscillator: The stochastic oscillator compares a particular closing price of a security to a range of its prices over a certain period of time. It generates a value between 0 and 100 and is used to identify overbought and oversold conditions.
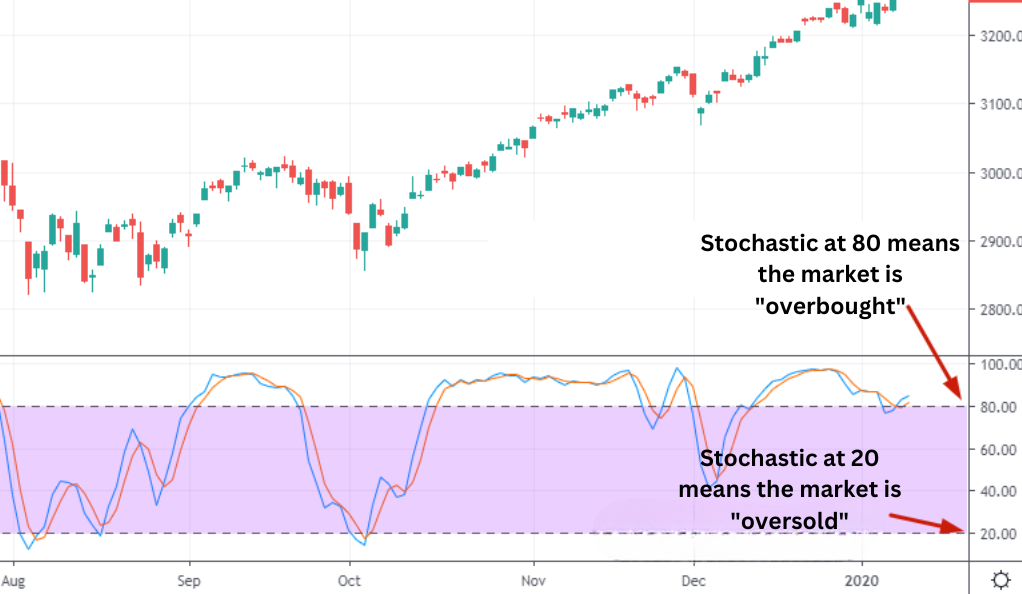
Example: If the MACD gives a bullish signal and the stochastic oscillator is below 20 (indicating an oversold condition), this could provide additional confirmation that it might be a good time to buy. Conversely, if the MACD gives a bearish signal and the stochastic oscillator is above 80 (indicating an overbought condition), this could confirm that it might be a good time to sell.
Remember, no indicator is perfect and they should all be used in conjunction with other tools and aspects of technical analysis. Always consider the overall trend, support and resistance levels, and other factors when making trading decisions.
MACD False Signals
The MACD, like any other technical indicator, is not infallible and can occasionally produce false signals. A false signal refers to an indication to buy or sell that does not reflect the actual market conditions and can lead to a losing trade. Here are some examples of how false signals can occur with the MACD and how to potentially mitigate them:
False Positive (Bullish Signal): This occurs when the MACD line crosses above the signal line, indicating a potential buy signal, but the price does not actually go up.
Example: Let’s say you’re looking at a daily chart and the MACD line crosses above the signal line, indicating a bullish signal. You decide to buy, but instead of going up, the price starts to fall. This is a false positive signal.
Mitigation: To mitigate the risk of false positive signals, you could wait for additional confirmation before entering a trade. For example, you might wait for the price to break above a resistance level or for another indicator, such as the RSI or a moving average, to also give a bullish signal.
False Negative (Bearish Signal): This occurs when the MACD line crosses below the signal line, indicating a potential sell signal, but the price does not actually go down.
Example: You’re looking at a daily chart and the MACD line crosses below the signal line, indicating a bearish signal. You decide to sell or short, but instead of going down, the price starts to rise. This is a false negative signal.
Mitigation: Similar to the false positive, you could wait for additional confirmation before entering a trade. For example, you might wait for the price to break below a support level or for another indicator, such as the RSI or a moving average, to also give a bearish signal.
Divergence False Signals: Divergence occurs when the price trend and the MACD trend are moving in opposite directions. While divergence can often indicate a potential reversal point, it can sometimes lead to false signals.
Example: The price is making higher highs while the MACD is making lower highs, indicating bearish divergence. You decide to sell, expecting the price to drop, but instead, it continues to rise.
Mitigation: Divergence can be a powerful signal, but it’s often best used in conjunction with other indicators and tools. For example, you might also look at the overall trend, support and resistance levels, and other momentum or volume indicators.
Remember, false signals are a part of trading and can never be completely eliminated. The goal is to develop a trading strategy that is right more often than it is wrong and to manage your risk effectively when you do have losing trades. Always use stop losses and only risk a small percentage of your trading capital on any single trade.
Trading Strategies with the MACD Indicator
The MACD isn’t just an indicator but can be a key part of various trading strategies. Here are some of the popular ones:

MACD Crossover Strategy: This strategy is based on the principle that when the MACD line (short-term trend) crosses above the signal line (long-term trend), it indicates a bullish market, and it might be a good time to buy. Conversely, when the MACD line crosses below the signal line, it suggests a bearish market, and it might be a good time to sell.
Example: Let’s say you’re trading a particular stock. You notice that the MACD line crosses above the signal line, indicating a bullish market. Based on this strategy, you decide to buy the stock. Over the next few days, the stock price rises, validating your decision. Later, when the MACD line crosses below the signal line, you decide to sell, thus making a profit from the rise in the stock price.
MACD Divergence Strategy: This strategy involves identifying when the price trend and the MACD trend are moving in opposite directions, a situation known as divergence. Divergence can indicate a potential reversal point, making it a good entry or exit point.
Example: If the price of a stock is making a series of higher highs while the MACD is making lower highs, this is known as bearish divergence and could indicate that the upward trend is losing momentum and a price drop may be coming. Conversely, if the price is making lower lows while the MACD is making higher lows (bullish divergence), this could signal that the downward trend is losing strength and a price rise may be imminent.
MACD and Moving Averages: Combining MACD with the 100 EMA can improve trading precision. If the price is below the 100 EMA, the long-term trend is likely down. If the price is above, the long-term trend is likely up.
Example: Suppose the price of a stock is above the 100 EMA, indicating a long-term upward trend. However, you notice that the MACD line has crossed below the signal line, suggesting a short-term downward trend. In this case, you might decide to wait until the MACD line crosses back above the signal line before buying the stock, as this would indicate that the short-term trend has aligned with the long-term trend.
MACD and Bollinger Bands: Combining MACD with Bollinger Bands can help traders identify overbought or oversold conditions in the market, presenting potential trading opportunities.
Example: Bollinger Bands consist of a middle band (a 20-day simple moving average) and an upper and lower band that are 2 standard deviations away from the middle band. If the price of a stock is near the upper band, it might be overbought, and if it’s near the lower band, it might be oversold. If the stock price is near the upper band and the MACD line crosses below the signal line, this could indicate that the stock is overbought and might be about to drop, so it could be a good time to sell or short the stock. Conversely, if the stock price is near the lower band and the MACD line crosses above the signal line, this could suggest that the stock is oversold and might be about to rise, so it could be a good time to buy.
MACD Best Time Frame
The MACD indicator can be used across various time frames, and the choice of time frame largely depends on your trading style and objectives. Here’s how you might use MACD in different time frames:
Long-term Trading (Swing Trading or Investing): If you’re a long-term trader or investor, you might use the MACD on a daily or weekly chart.
Example: Let’s say you’re looking at a daily chart, where each candlestick represents one day of trading. You notice that the MACD line (the faster line) crosses above the signal line (the slower line), indicating a bullish signal. This could be a sign to consider entering a long position (buying). You would continue to hold this position until the MACD line crosses back below the signal line, indicating a bearish signal and a potential time to sell.
Short-term Trading (Day Trading or Scalping): If you’re a short-term trader, you might use the MACD on a much shorter time frame, such as a 1-hour, 15-minute, or even 5-minute chart.
Example: Let’s say you’re looking at a 15-minute chart, where each candlestick represents 15 minutes of trading. You notice that the MACD line crosses below the signal line, indicating a bearish signal. This could be a sign to consider entering a short position (selling with the intention to buy back at a lower price). You would continue to hold this position until the MACD line crosses back above the signal line, indicating a bullish signal and a potential time to buy back the shares you sold.
Remember, shorter time frames will result in more trading signals, but they may also lead to more false signals. This is because shorter time frames can be more influenced by minor price fluctuations and market noise.
Regardless of the time frame you choose, it’s important to use the MACD in conjunction with other technical analysis tools and indicators. For example, you might use support and resistance levels, trend lines, or other indicators like the Relative Strength Index (RSI) or Bollinger Bands to confirm the signals given by the MACD.
Also, always remember to use proper risk management techniques, such as setting stop losses and only risking a small percentage of your trading capital on any single trade. This can help protect your trading capital from significant losses.
Finally, it’s a good idea to backtest your trading strategy on historical data to see how it would have performed in the past before you use it in live trading. This can help you fine-tune your strategy and get a better understanding of how it works in different market conditions.
To ensure the best use of the MACD indicator, consider these tips:
Use Stop Loss: Implement stop-loss orders to limit potential losses when market movements contradict your prediction.
Combine Indicators: Combine the MACD with other technical indicators like the Relative Strength Index (RSI) or Stochastic Oscillator to confirm trends and generate stronger trading signals.
Set Price Alerts: Set alerts when the MACD crosses the signal line or when other significant movements occur to take timely trading actions.
Key Takeaways
To wrap up, remember these key points:
- The MACD line, signal line, histogram, and zero line are the main components of the MACD Indicator.
- The MACD helps identify potential buy and sell points, bullish and bearish trends, and momentum in the market.
- Trading strategies can be improved by combining the MACD with other technical indicators.
- Always consider your risk tolerance and use stop-loss orders to protect your investments.
Conclusion
The MACD is a powerful tool that, when used correctly, can provide insightful information about market trends and momentum. It’s an essential part of a trader’s toolkit that can significantly improve trading strategies when properly understood and effectively utilized. Remember, no indicator is flawless, and it’s crucial to consider other market factors when making trading decisions.
As we conclude this comprehensive guide on the MACD Indicator, we hope you are better equipped to harness its potential in your trading activities. Stay tuned for more in-depth trading guides to continue refining your trading skills!
WeInvests is a financial portal-based research agency. We do our utmost best to offer reliable and unbiased information about crypto, finance, trading and stocks. However, we do not offer financial advice and users should always carry out their own research.
Read More